Viper Tuner Manual
Home Screen

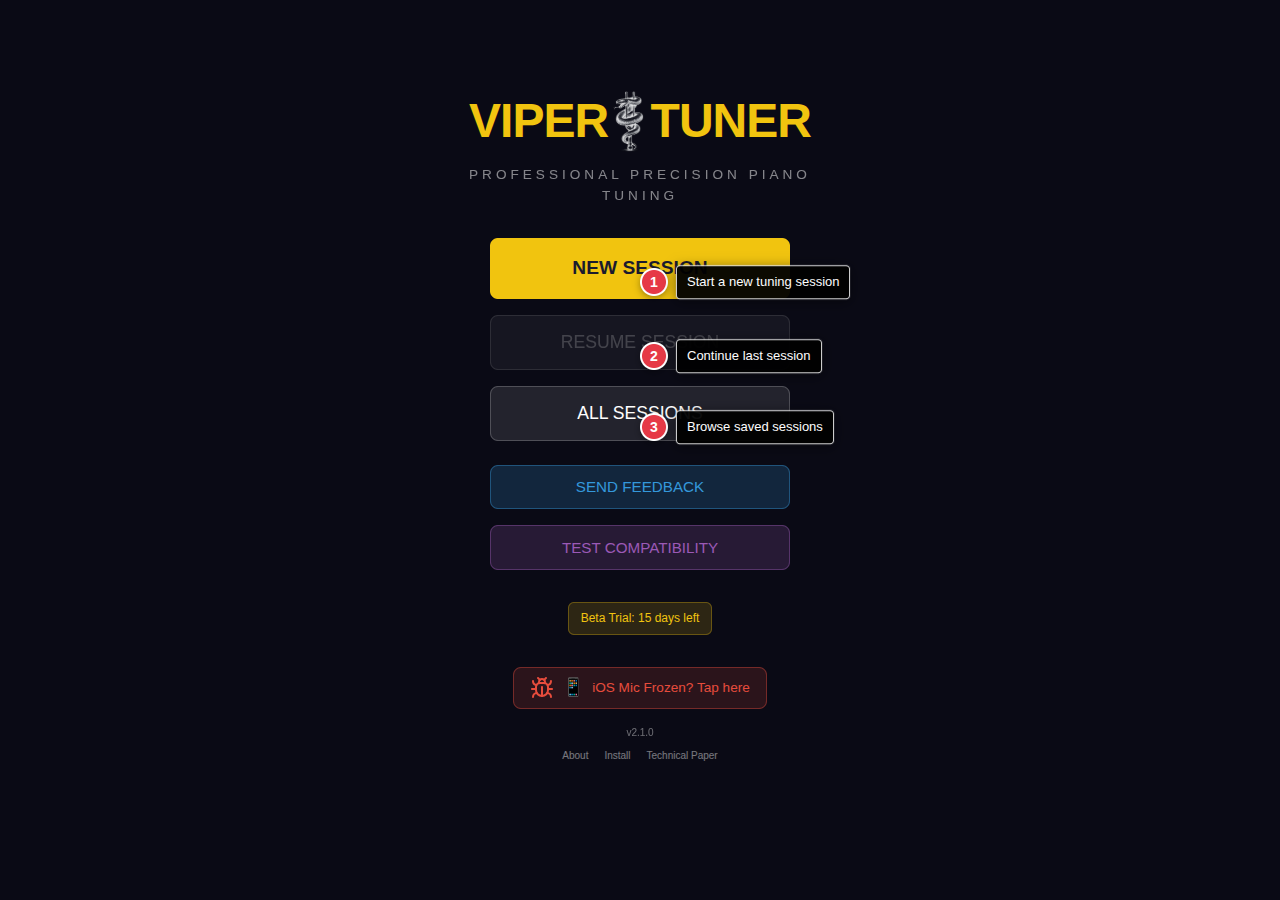
The home screen provides quick access to start a new tuning session, resume a previous session, or browse saved tuning data.
| # | Button | Description |
|---|---|---|
| 1 | NEW SESSION | Starts a new tuning session. Proceeds to workflow selection (Classic or Measure). |
| 2 | RESUME SESSION | Continues the last active tuning session if one exists. |
| 3 | ALL SESSIONS | Browse, load, and manage all saved tuning sessions. |
| 4 | TOOLS | Access aural tuning tools, sequence finder, and temperament browser. See Tools section. |
New Session
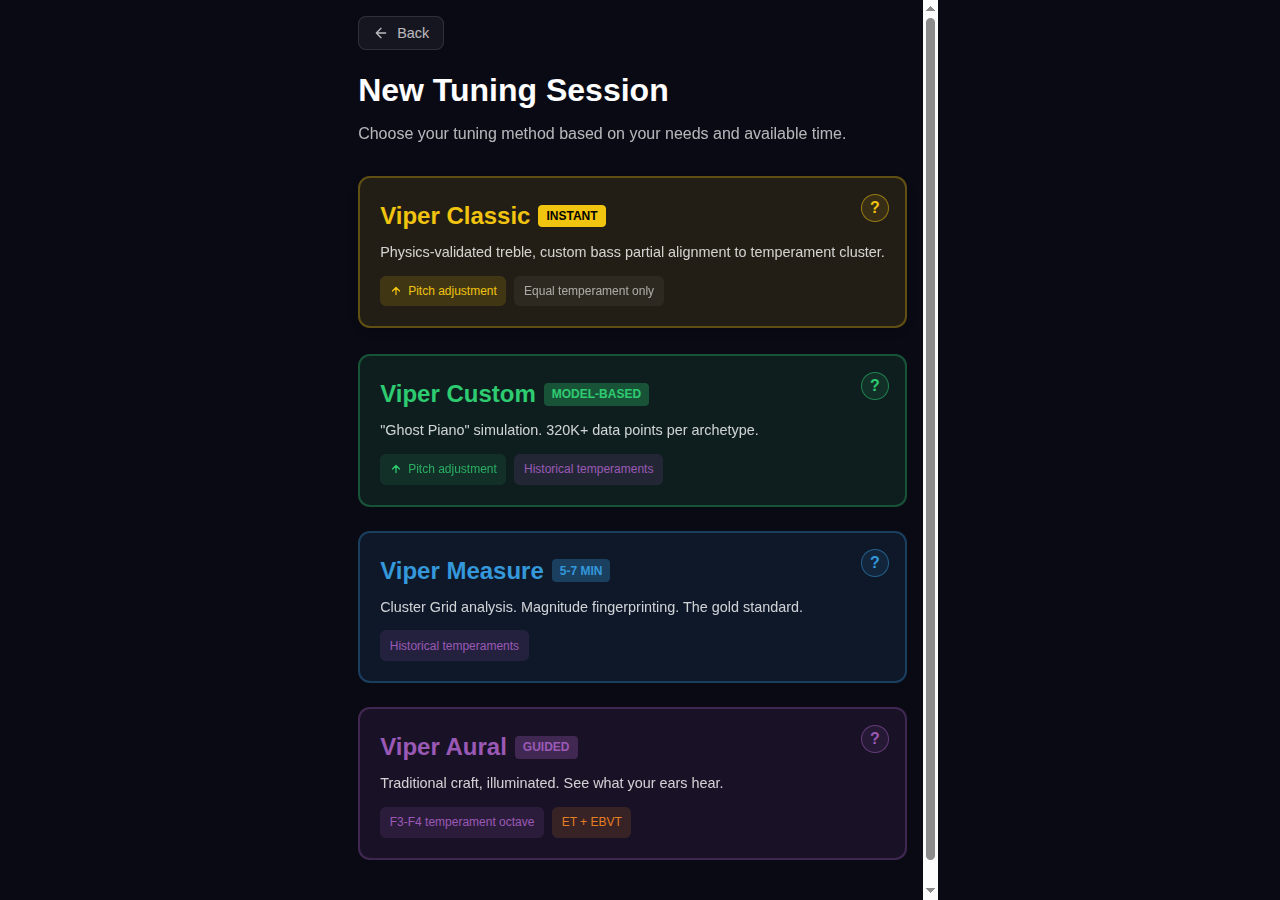
Choose how to generate the tuning curve for your piano. Viper Tuner offers two primary workflows:
| # | Workflow | Description |
|---|---|---|
| 1 | Viper Classic | Instant start. Physics-validated treble universality combined with bass partial alignment to temperament cluster. Best for most tuning situations—eliminates measurement noise while respecting each piano's unique bass character. |
| 2 | Viper Measure | Cluster Grid analysis with magnitude fingerprinting. Measures your specific piano's inharmonicity (5-7 minutes). The gold standard for concert prep, recording sessions, and non-conforming instruments. |
Note: Aural tuning tools (temperament sequences, interval checks, octave expansion) are accessible from the Tools menu on the home screen—they complement both workflows rather than standing as a separate mode.
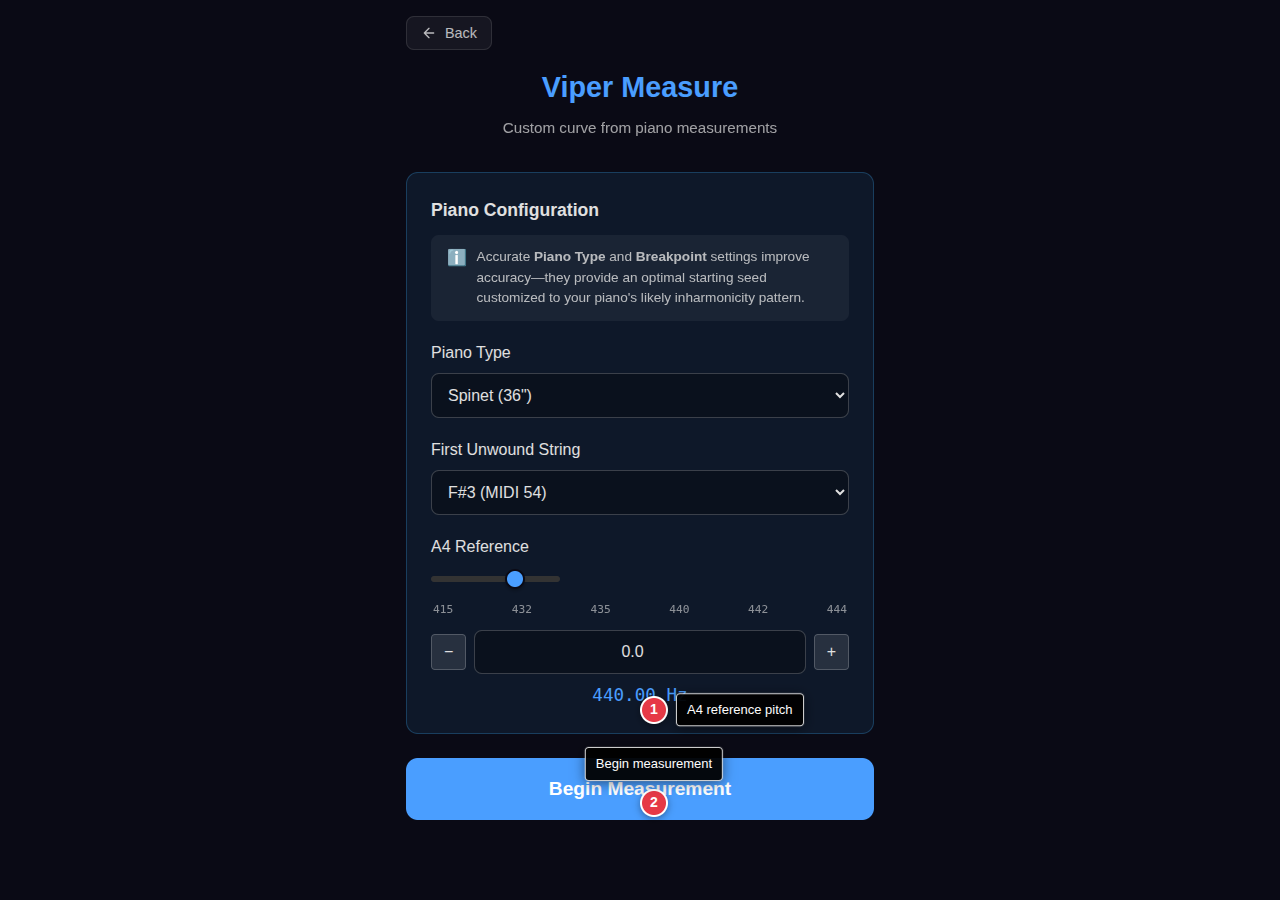
Classic Setup
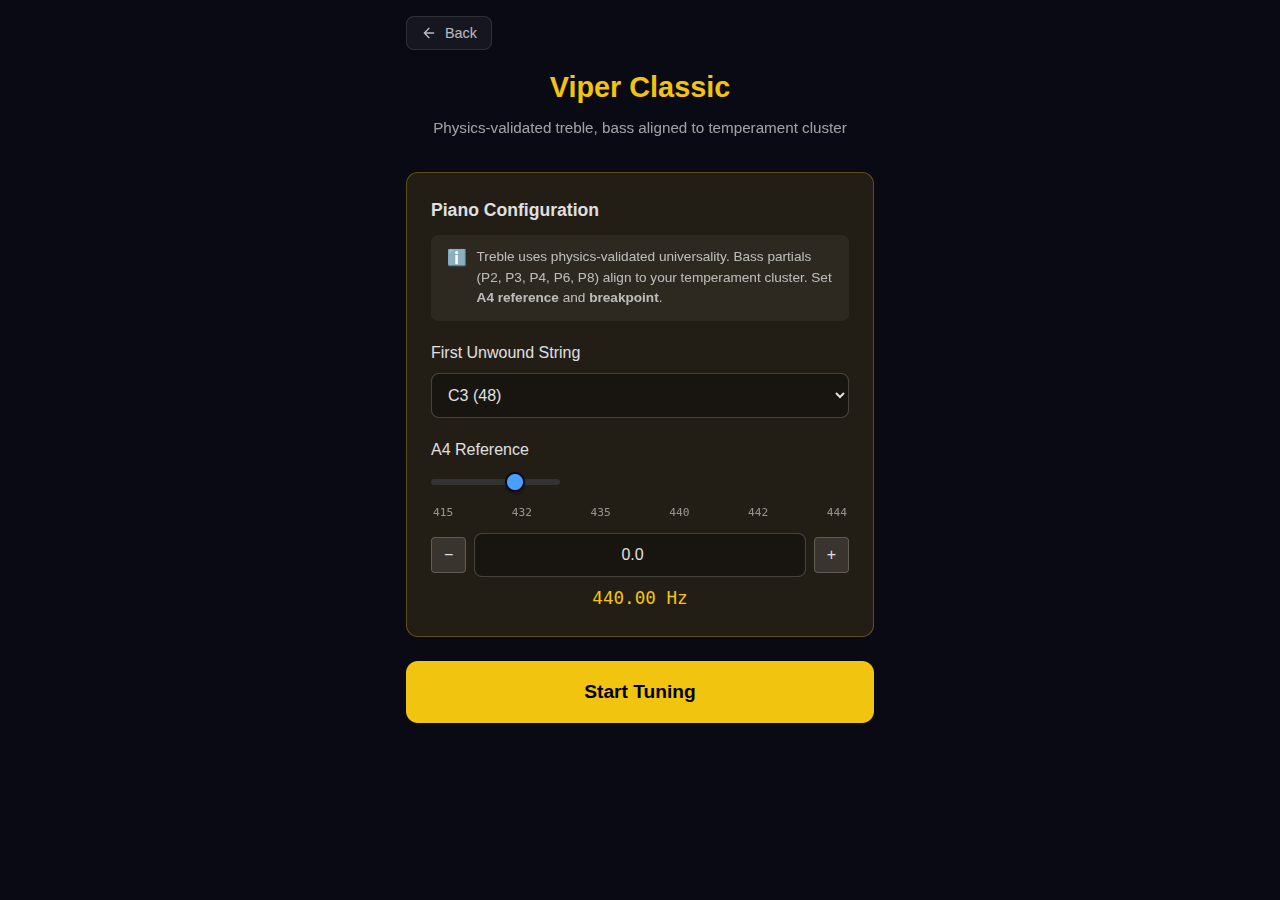
Classic mode provides a quick path to tuning with two settings: the first unwound string (breakpoint) and the A4 reference pitch.
| # | Control | Description |
|---|---|---|
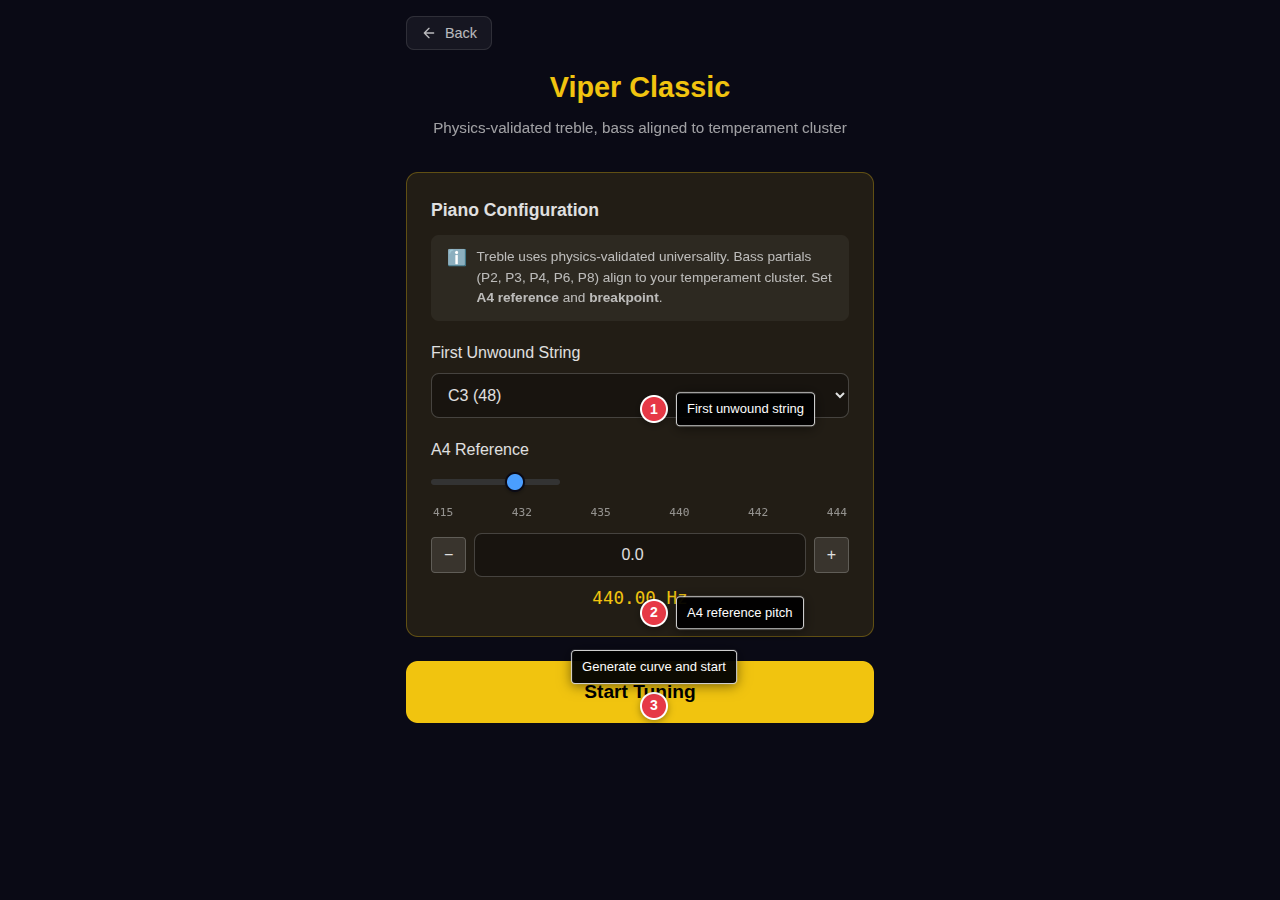
| 1 | First Unwound String | Select where the bass wound strings end and treble unwound strings begin (E2–G#3, default C3). This breakpoint determines how bass partials are aligned to the temperament cluster. |
| 2 | A4 Reference | Set the reference pitch for A4 (standard is 440 Hz). Adjust with the slider, numeric input, or quick-jump preset buttons (415, 432, 435, 440, 442, 444 Hz). |
| 3 | Start Tuning | Generate the tuning curve and proceed to the tuning screen. |
Note: The treble curve and bass partial alignments are built into the Classic model—selecting the correct breakpoint ensures the bass stretch matches your piano's stringing. For a fully measured curve, use the Measure workflow.
Measure Setup
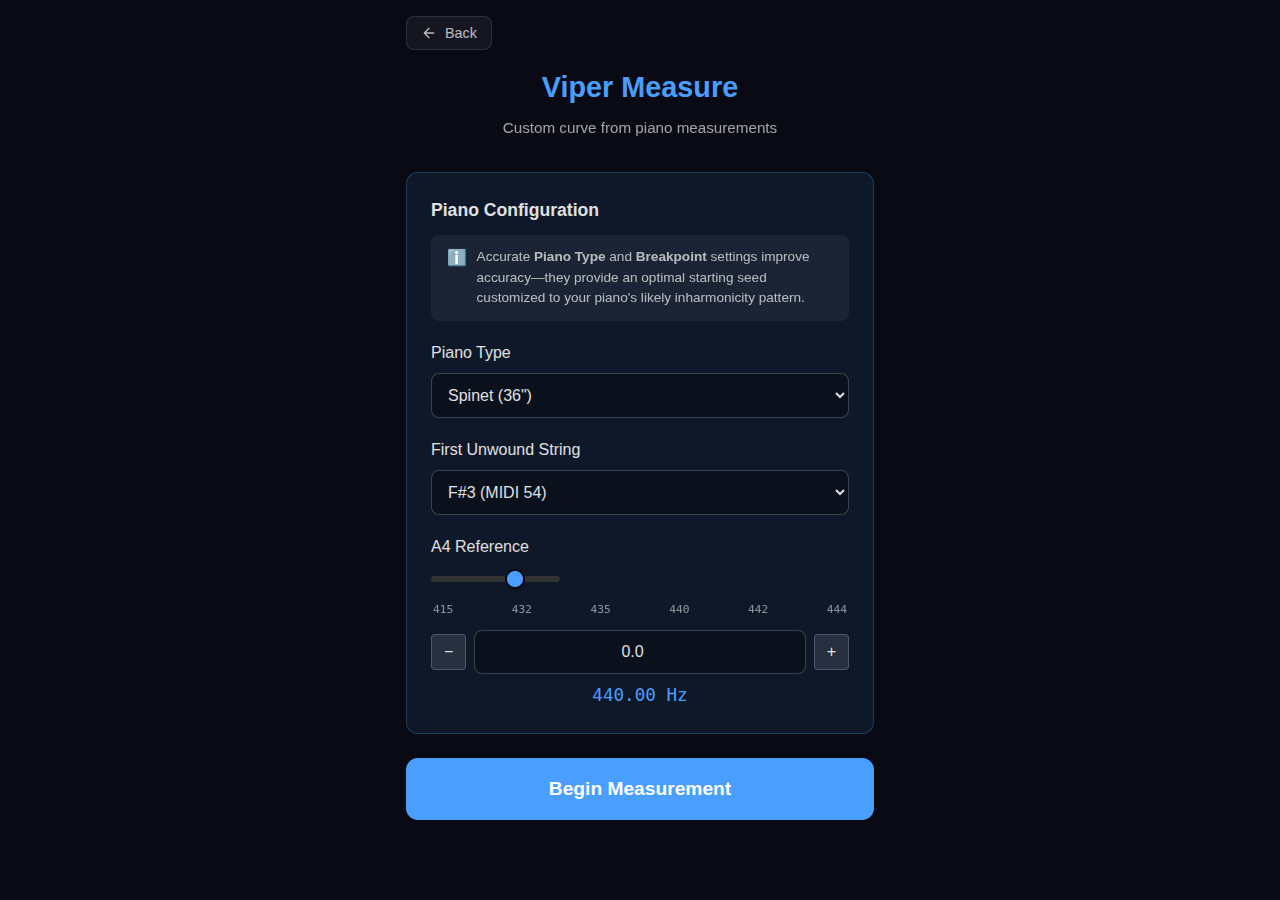
Measure mode analyzes your piano's actual inharmonicity by recording each note. This produces the most accurate tuning curve tailored to your specific instrument.
Configure measurement options before beginning:
- A4 Reference — Set concert pitch (default 440 Hz)
- Start Measuring — Begin the measurement workflow
Note: Measurement takes 3-5 minutes for the full keyboard. You can measure fewer notes for a quicker result, but accuracy improves with more data points.
Measurement
The measurement screen guides you through recording your piano's notes to capture inharmonicity data. The process has four states: preparation, recording, processing, and results.
Pre-Recording
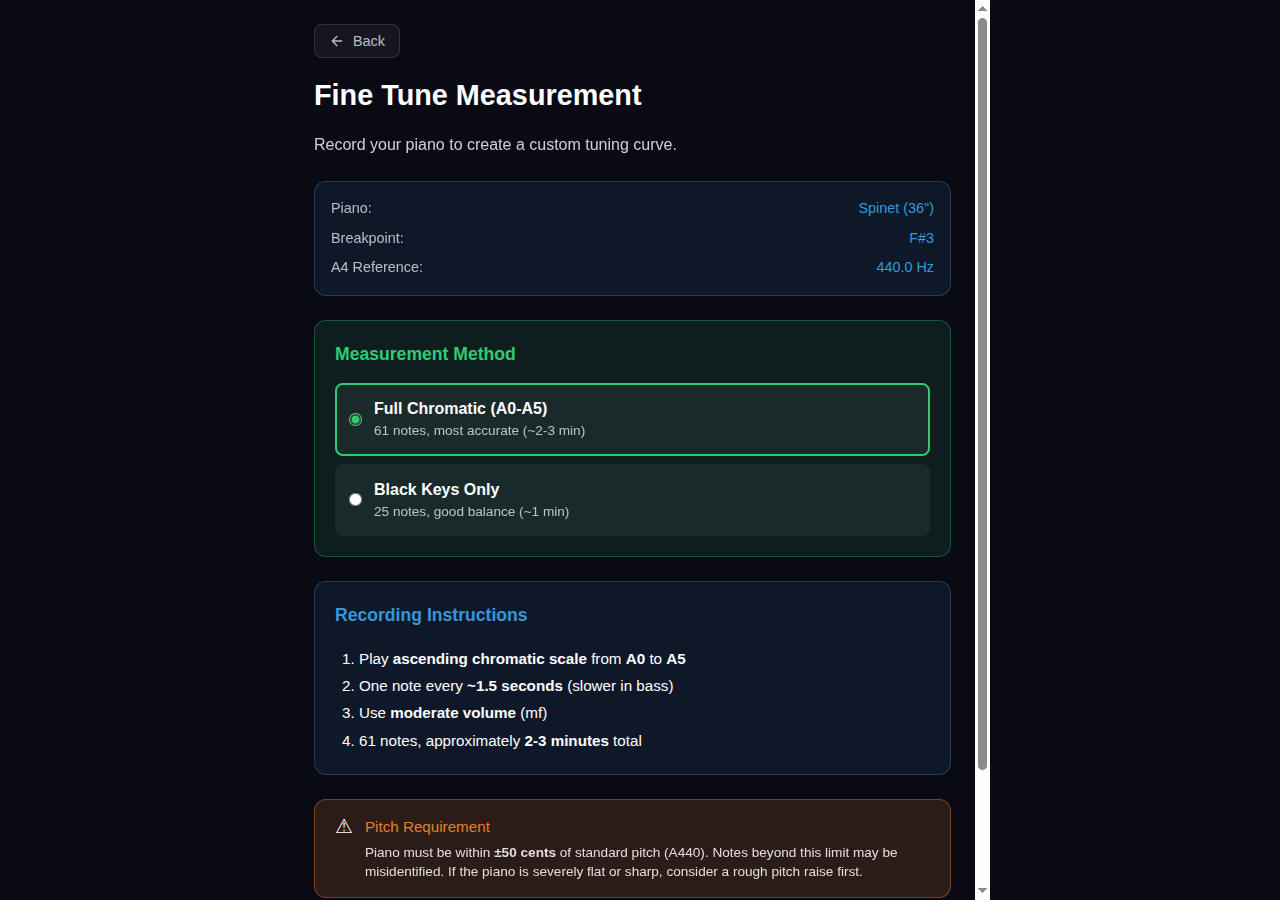
Before recording begins, select your measurement protocol and prepare the microphone.
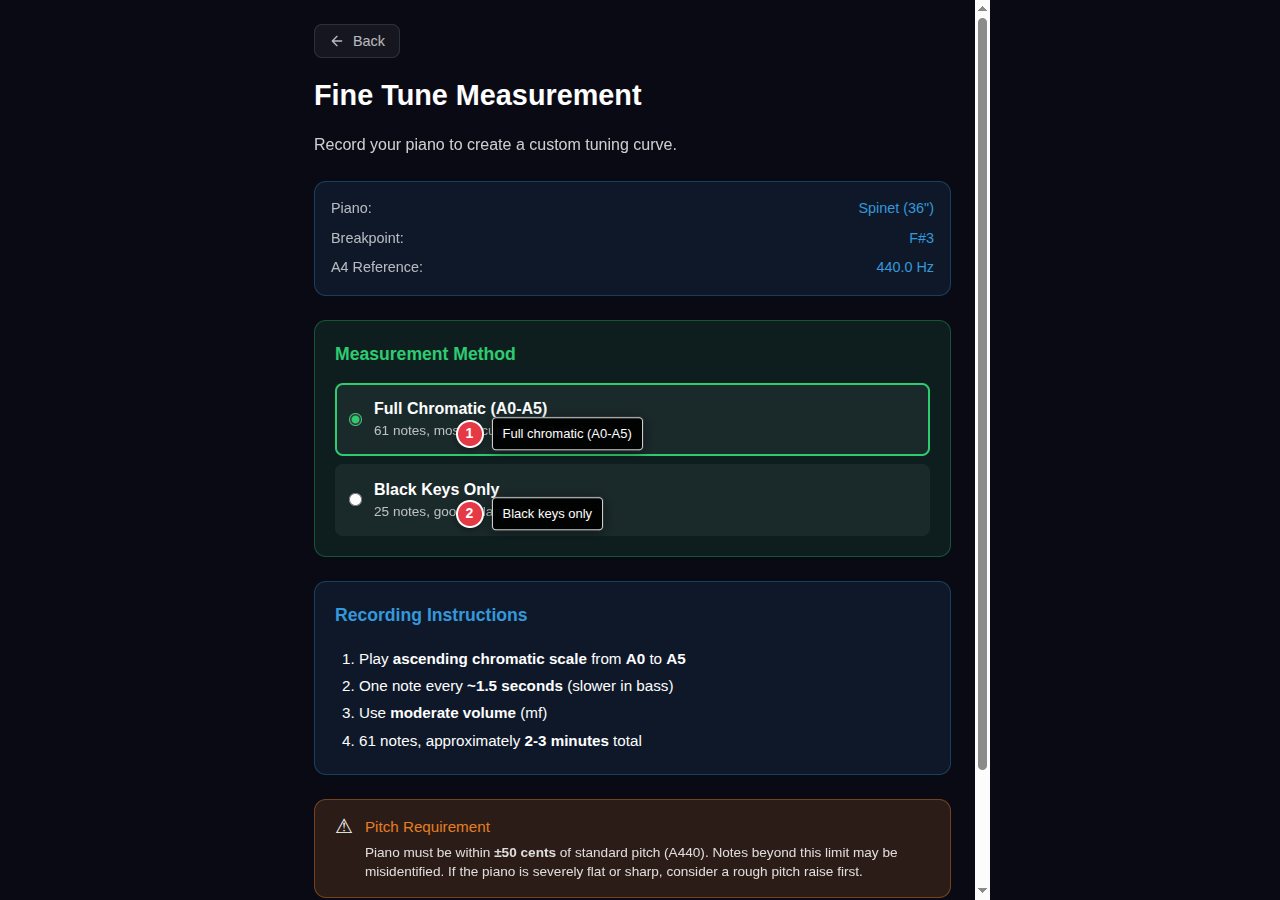
| # | Control | Description |
|---|---|---|
| 1 | Full Chromatic | Records A0 through A5 (every white and black key in the measured range). Provides maximum accuracy. |
| 2 | Black Keys Only | Records only black keys (sharps/flats). Faster measurement with good accuracy for most situations. |
| 3 | Load WAV | Import a previously recorded measurement file instead of recording live. |
| 4 | Start Recording | Begin the measurement recording session. |
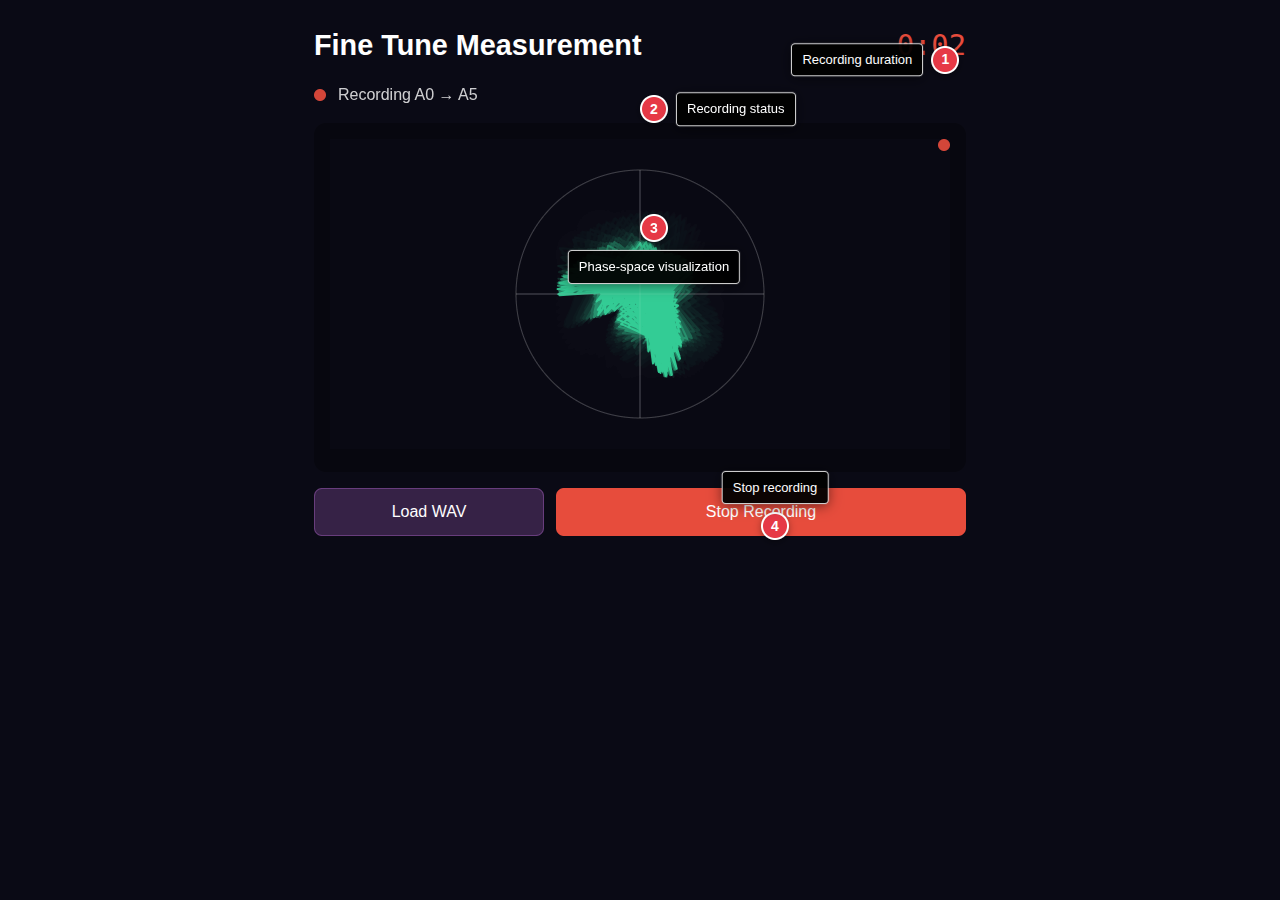
Recording
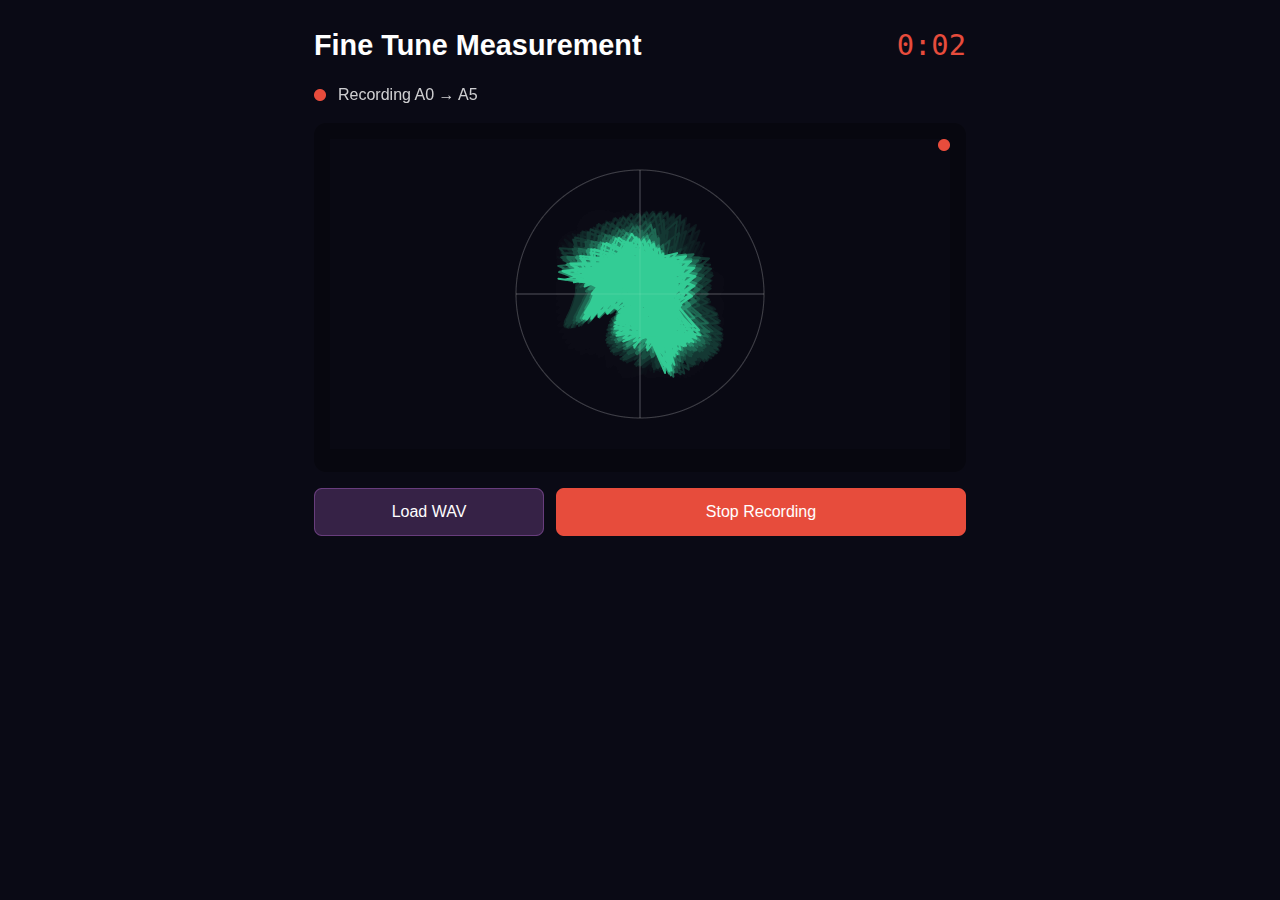
During recording, play each note in the selected protocol from low to high. The phase-space visualization shows audio activity and helps confirm the microphone is capturing sound.
| # | Element | Description |
|---|---|---|
| 1 | Recording Timer | Shows elapsed recording time. Full chromatic typically takes 3-5 minutes. |
| 2 | Recording Indicator | Confirms that audio capture is active. |
| 3 | Phase-Space Display | Real-time visualization of audio signal. Active notes create distinctive patterns; silence shows minimal activity. |
| 4 | Stop Recording | End the recording session and begin analysis. |
Tip: Play each note firmly and let it ring for 1-2 seconds before moving to the next. The algorithm detects note onsets automatically—you don't need to time your playing precisely.
Results
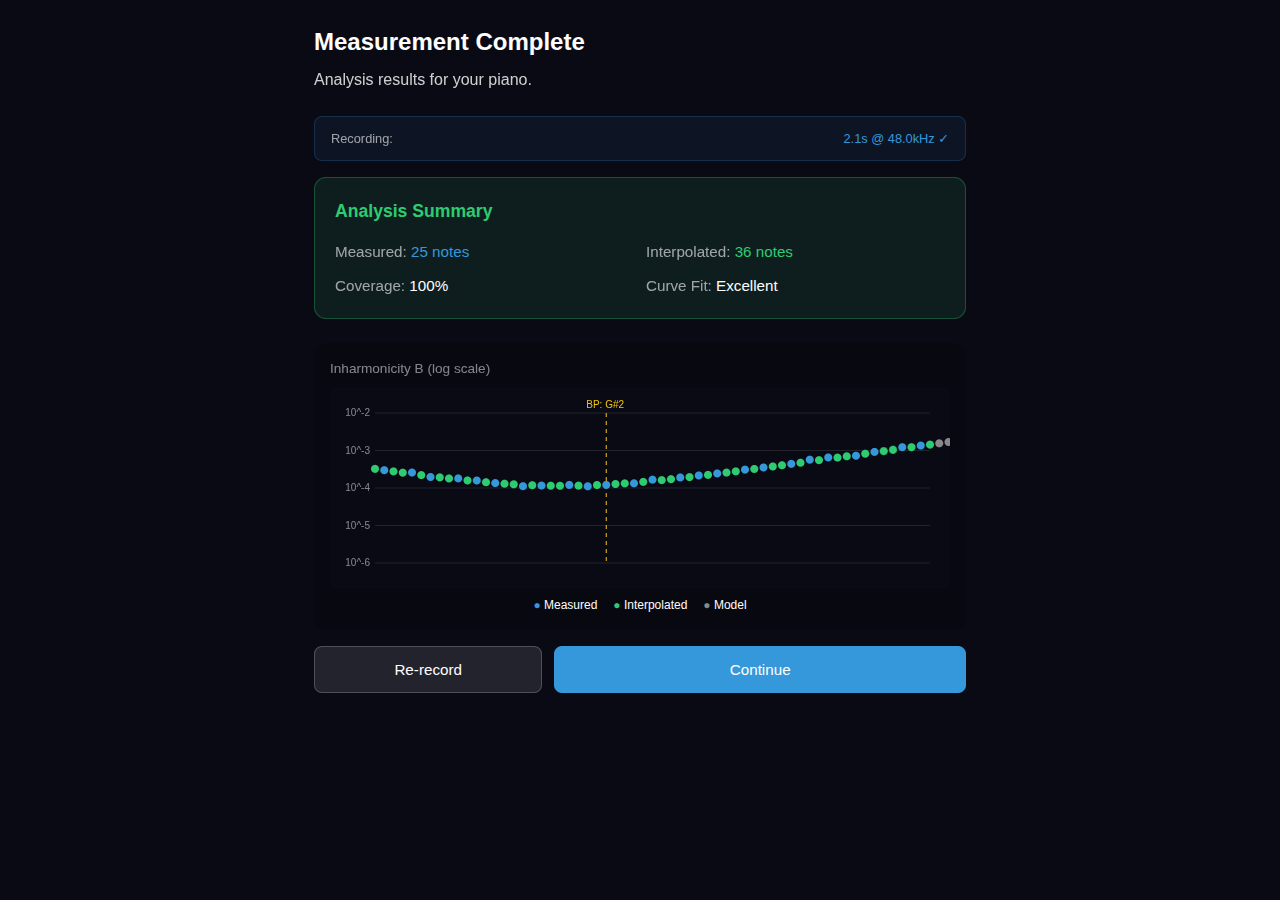
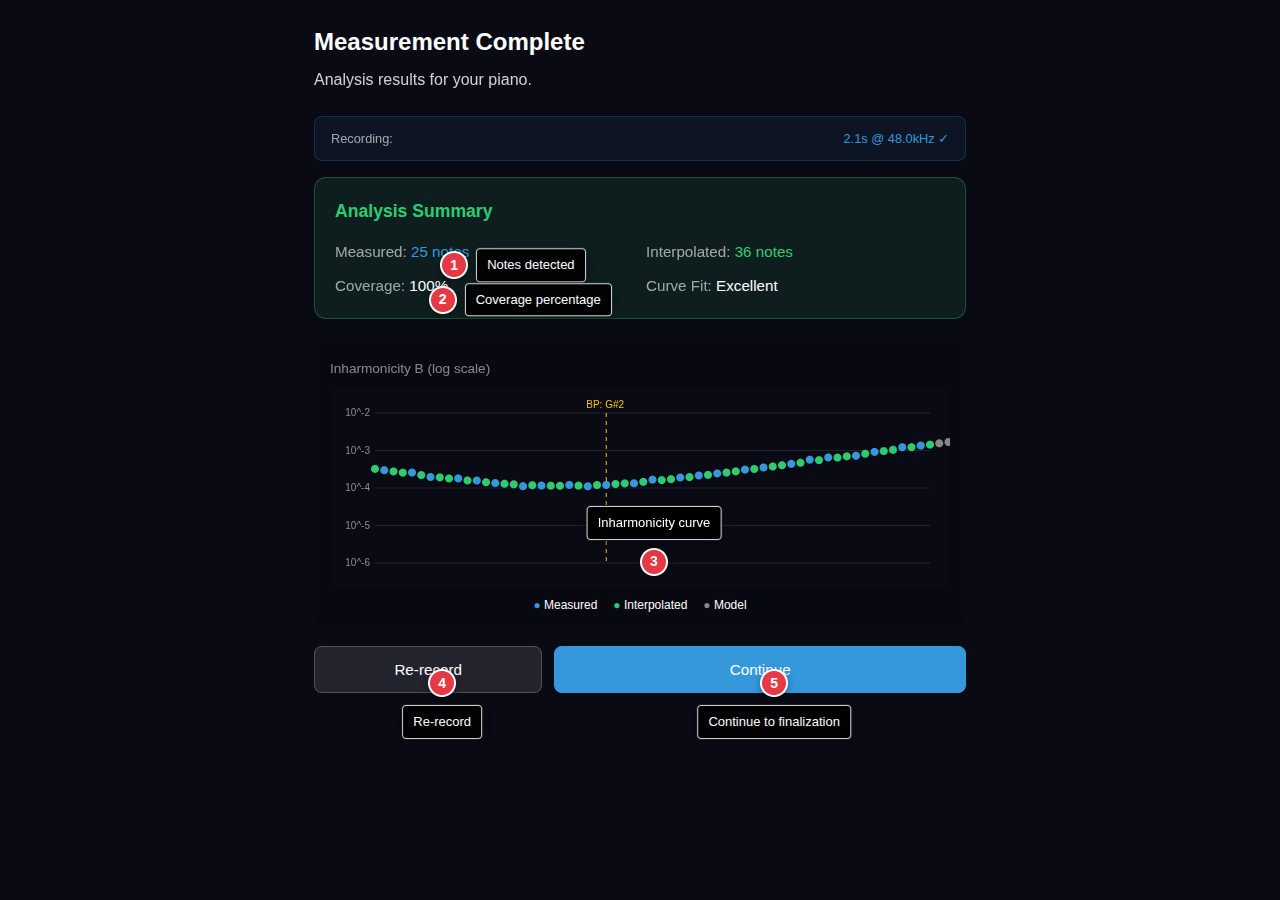
After processing, the results screen displays a summary of the detected notes and measured inharmonicity curve.
| # | Element | Description |
|---|---|---|
| 1 | Notes Detected | Number of distinct notes successfully identified in the recording. |
| 2 | Coverage | Percentage of the target range captured. Higher coverage produces more accurate curves. |
| 3 | Inharmonicity Curve | Preview of the measured B coefficient curve showing your piano's string characteristics. |
| 4 | Re-record | Discard results and start a new recording if quality is poor. |
| 5 | Continue | Accept results and proceed to the finalization screen. |
Note: If coverage is below 80%, consider re-recording. Missing notes in the bass or around the break point can reduce curve accuracy.
Measured Finalization
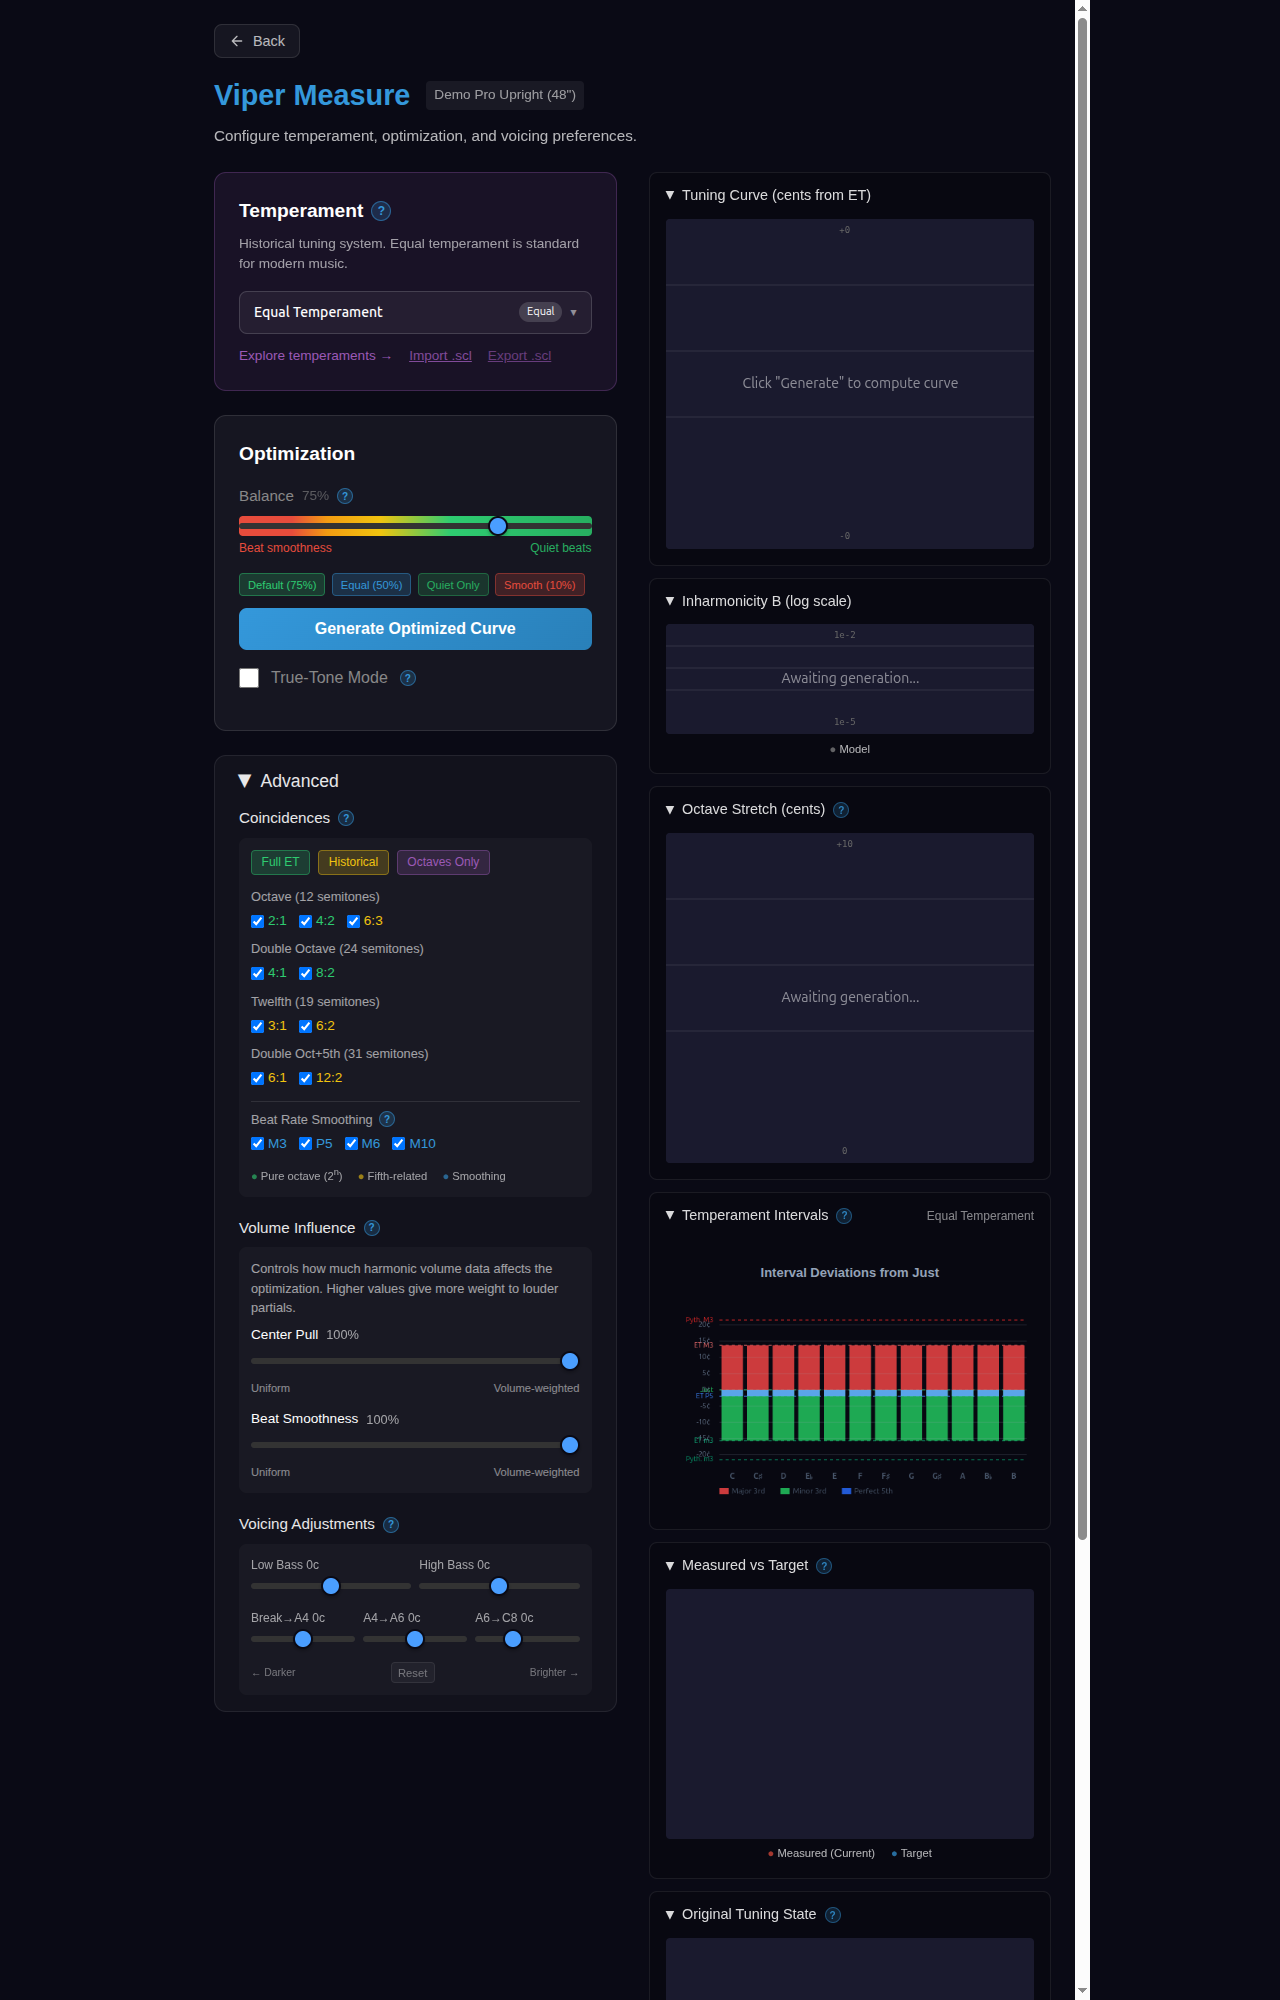
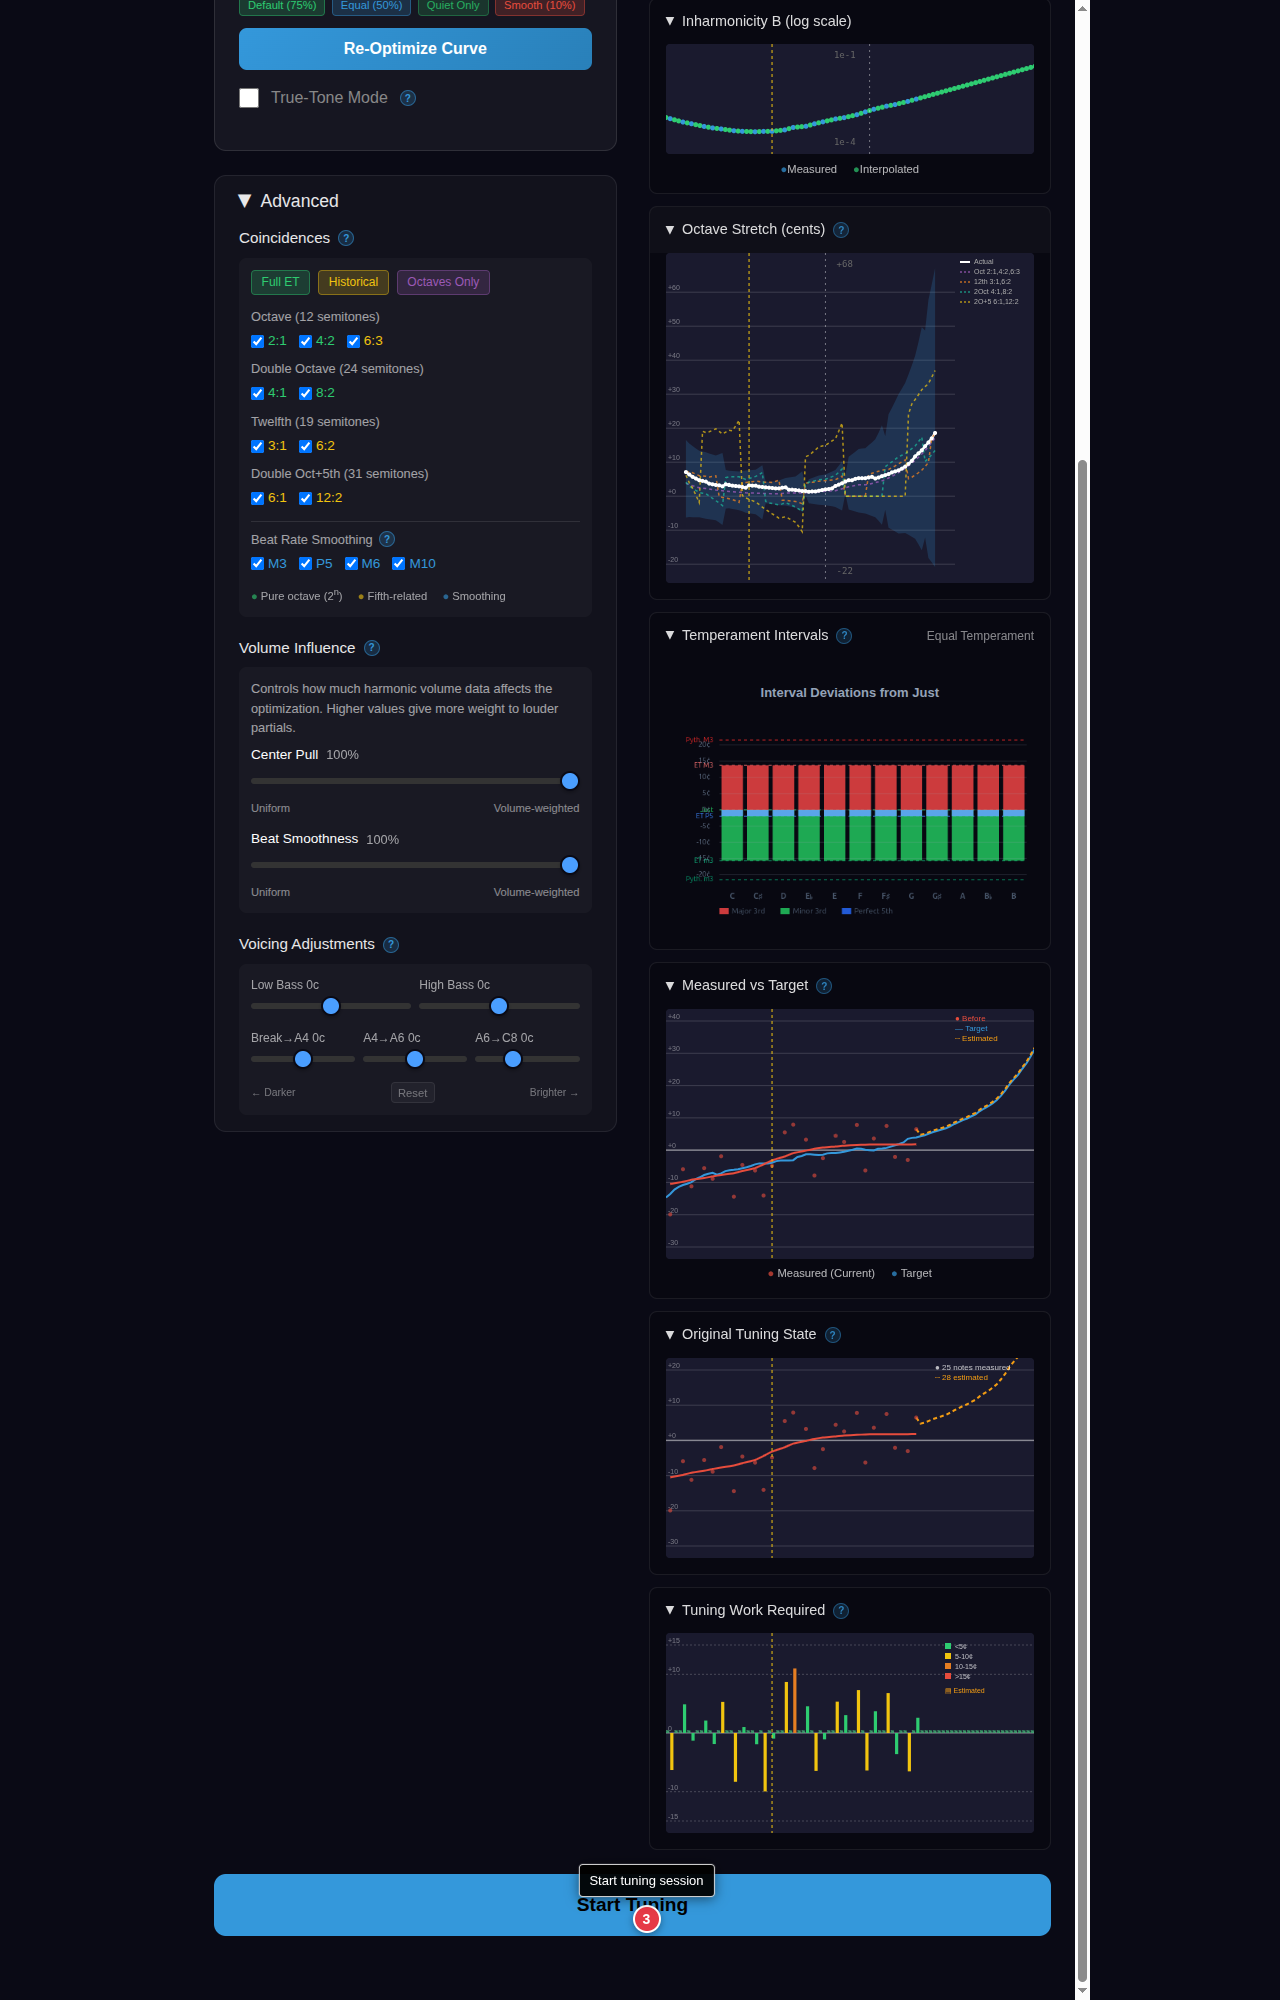
After measuring your piano, the finalization screen shows comprehensive analysis of the measured data and generated tuning curve.
Generated Curve
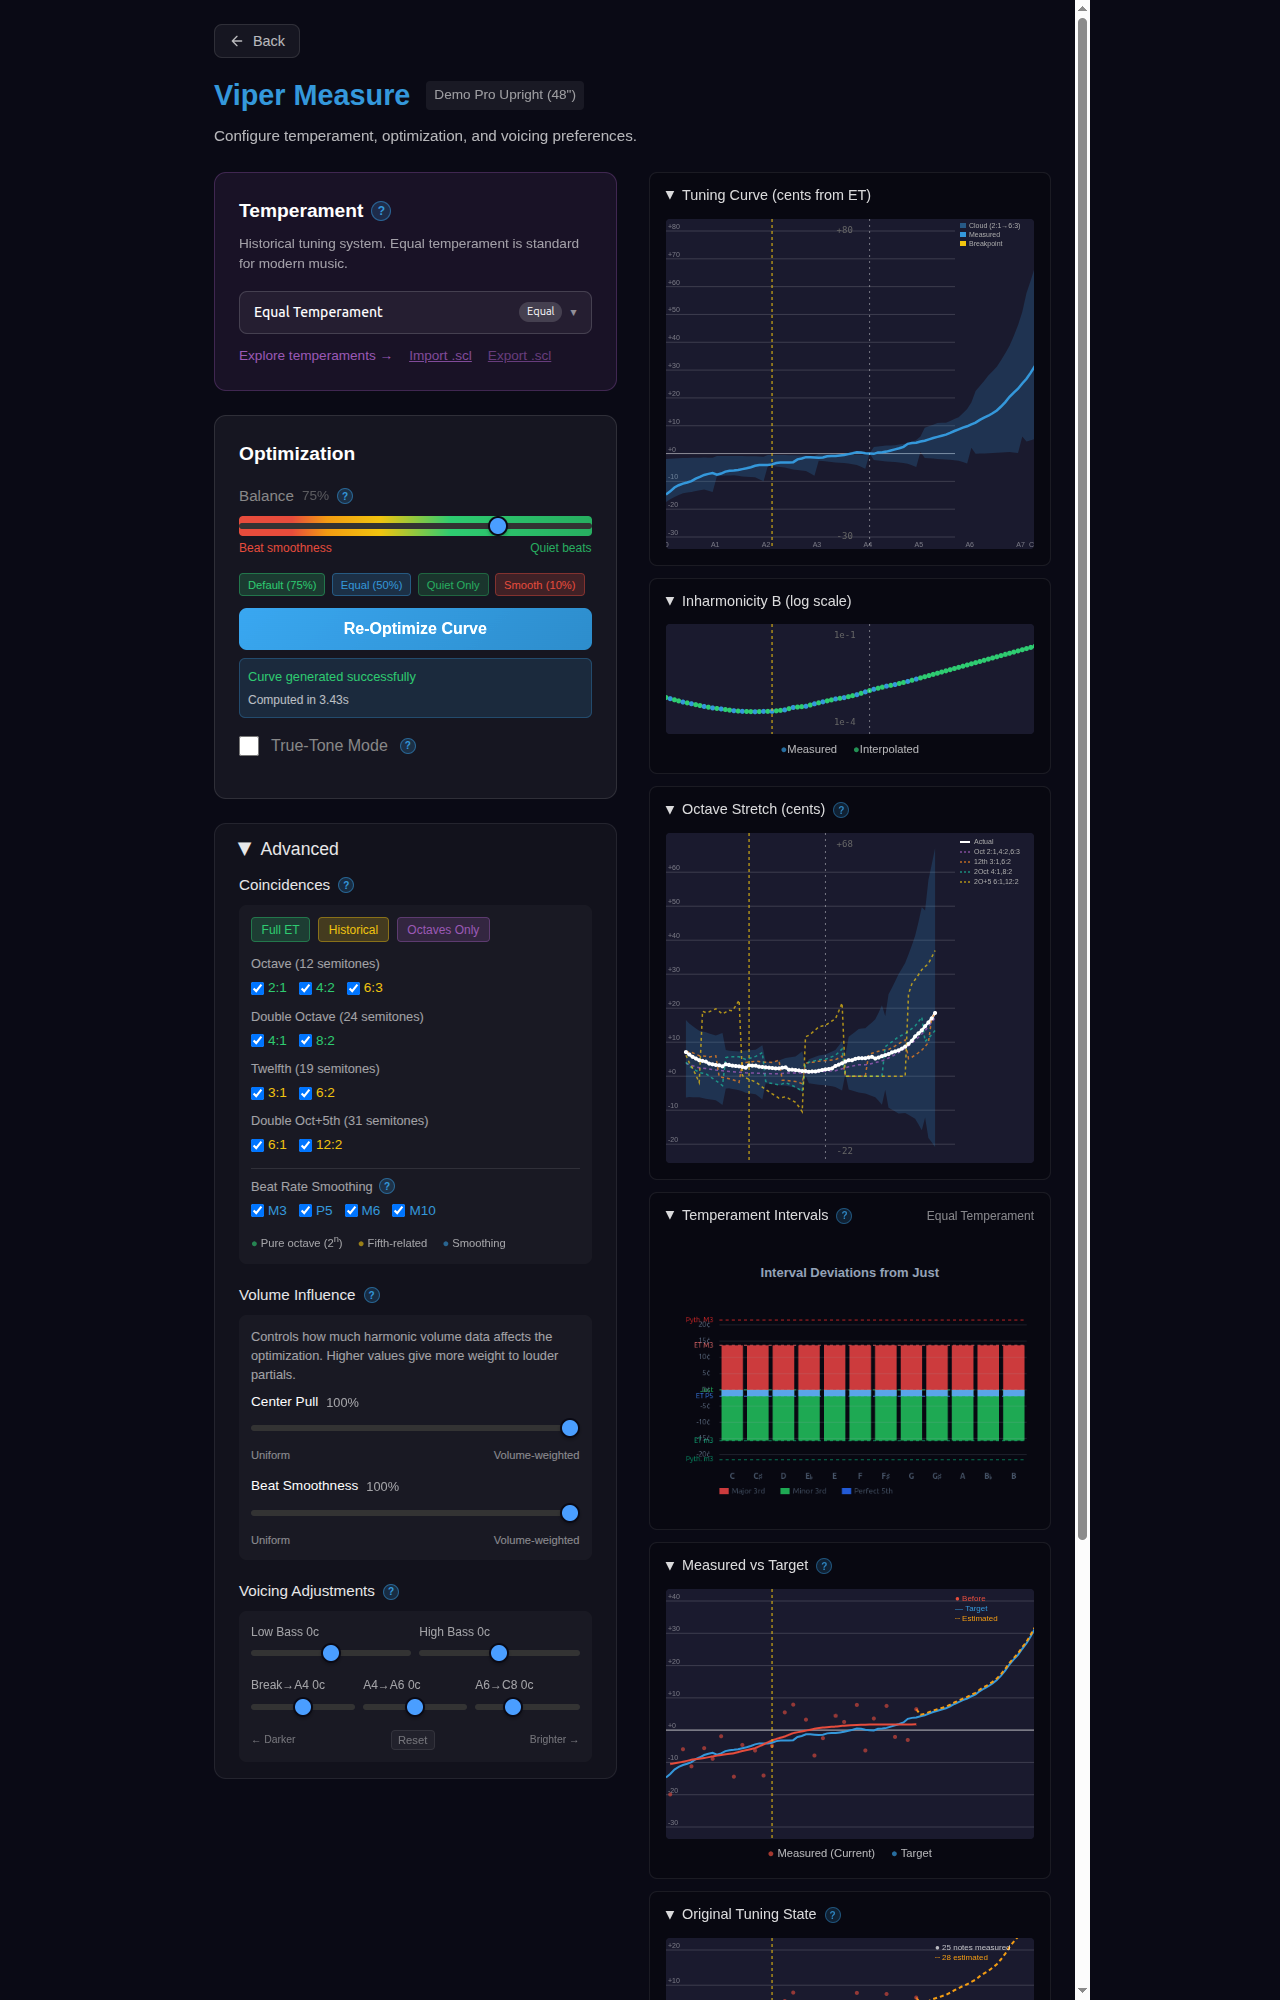
The measured mode provides additional charts beyond custom mode:
- Before/After — Compare measured tuning state to generated targets
- Pre-Tuning State — Shows how flat/sharp each note was before tuning
- Work Required — Highlights notes needing the most adjustment
Tip: Click any chart to expand it to fullscreen for detailed viewing.
Expanded Chart Views
Click any chart to view it fullscreen with enhanced detail. Measured mode includes all standard charts plus three measurement-specific charts:
Tuning Curve (Expanded)
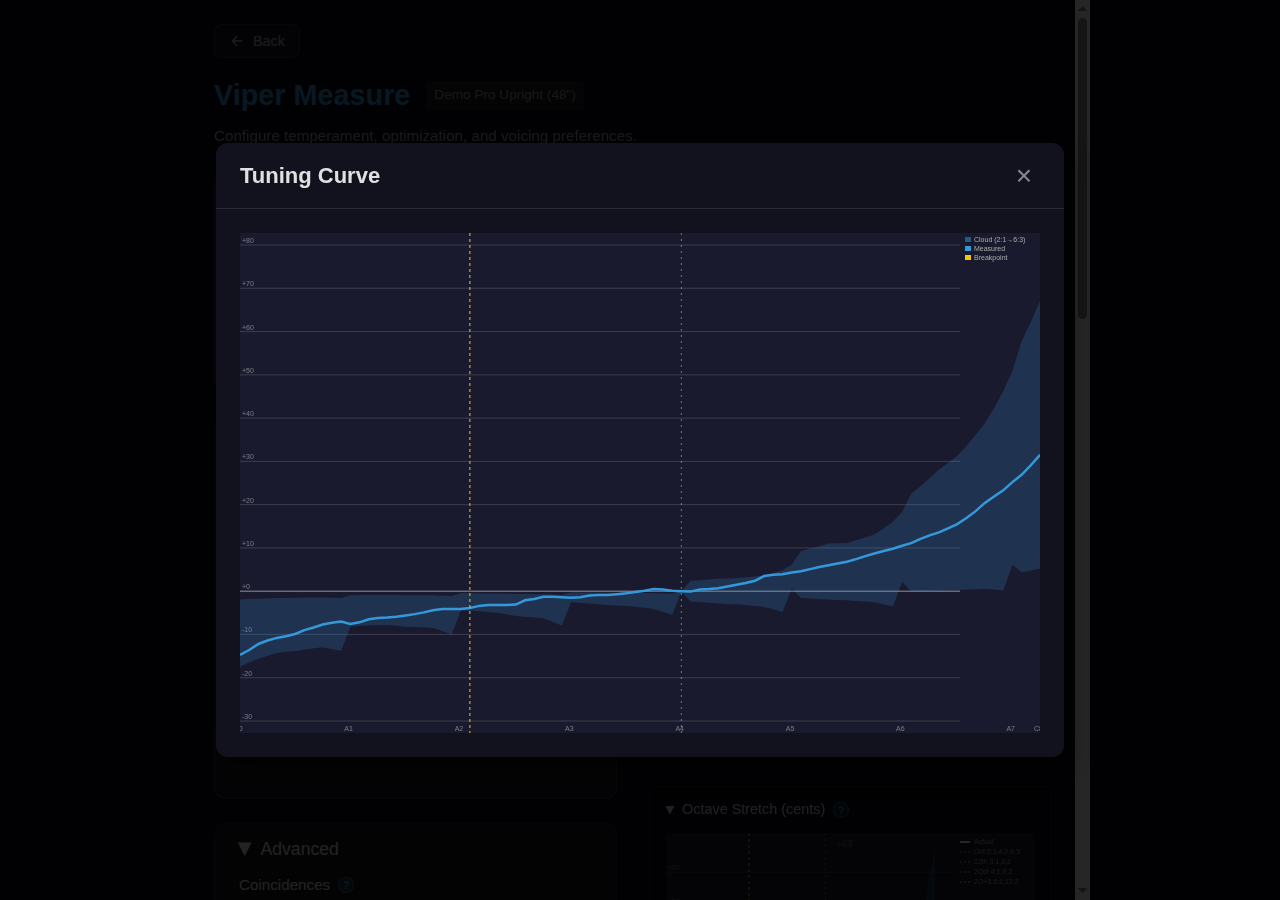
Shows the target cents offset from Equal Temperament based on your piano's measured inharmonicity. The blue curve reflects your specific instrument's characteristics rather than a generic model. See Tuning Curve chart description above for element details.
Inharmonicity (Expanded)
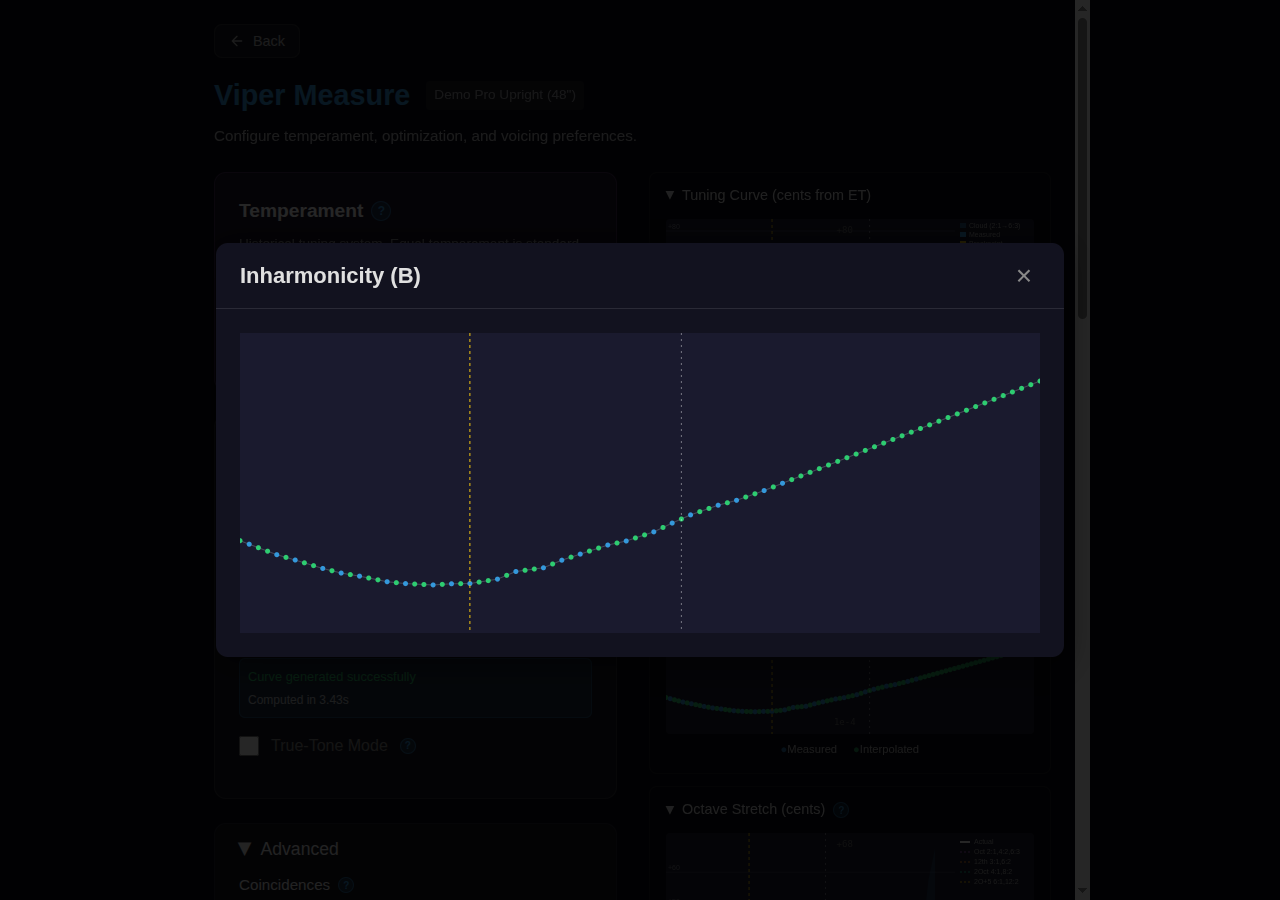
Displays the measured B coefficient for each note. In measured mode, you'll see a mix of blue dots (directly measured notes) and green dots (interpolated between measurements). The actual break point location is determined from your measurements rather than estimated.
Octave Stretch (Expanded)
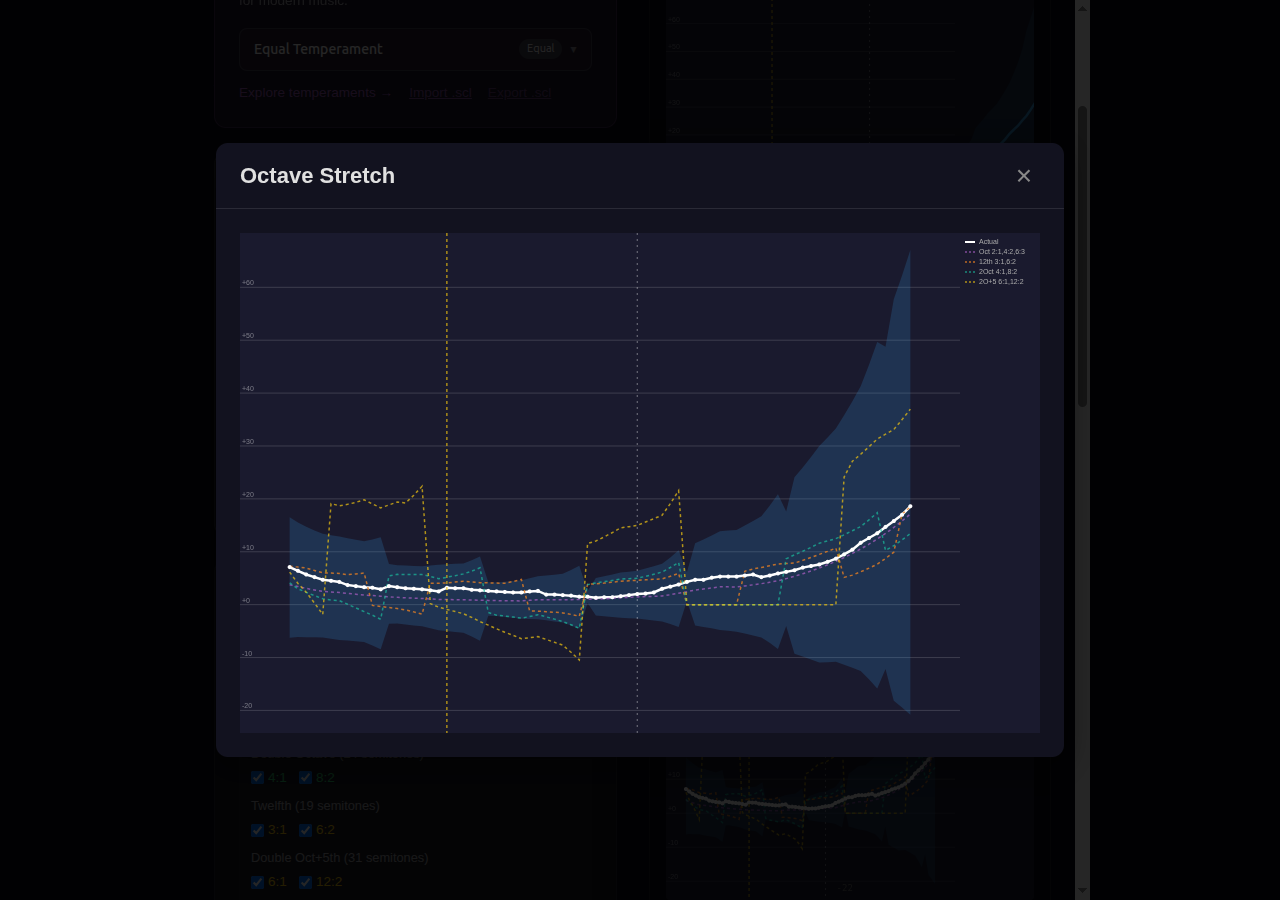
Shows calculated octave stretch based on your measured inharmonicity data. The cloud bounds and coincidence lines reflect your piano's actual string characteristics. See Tuning Curve chart description above for element details.
Before/After Comparison (Expanded)
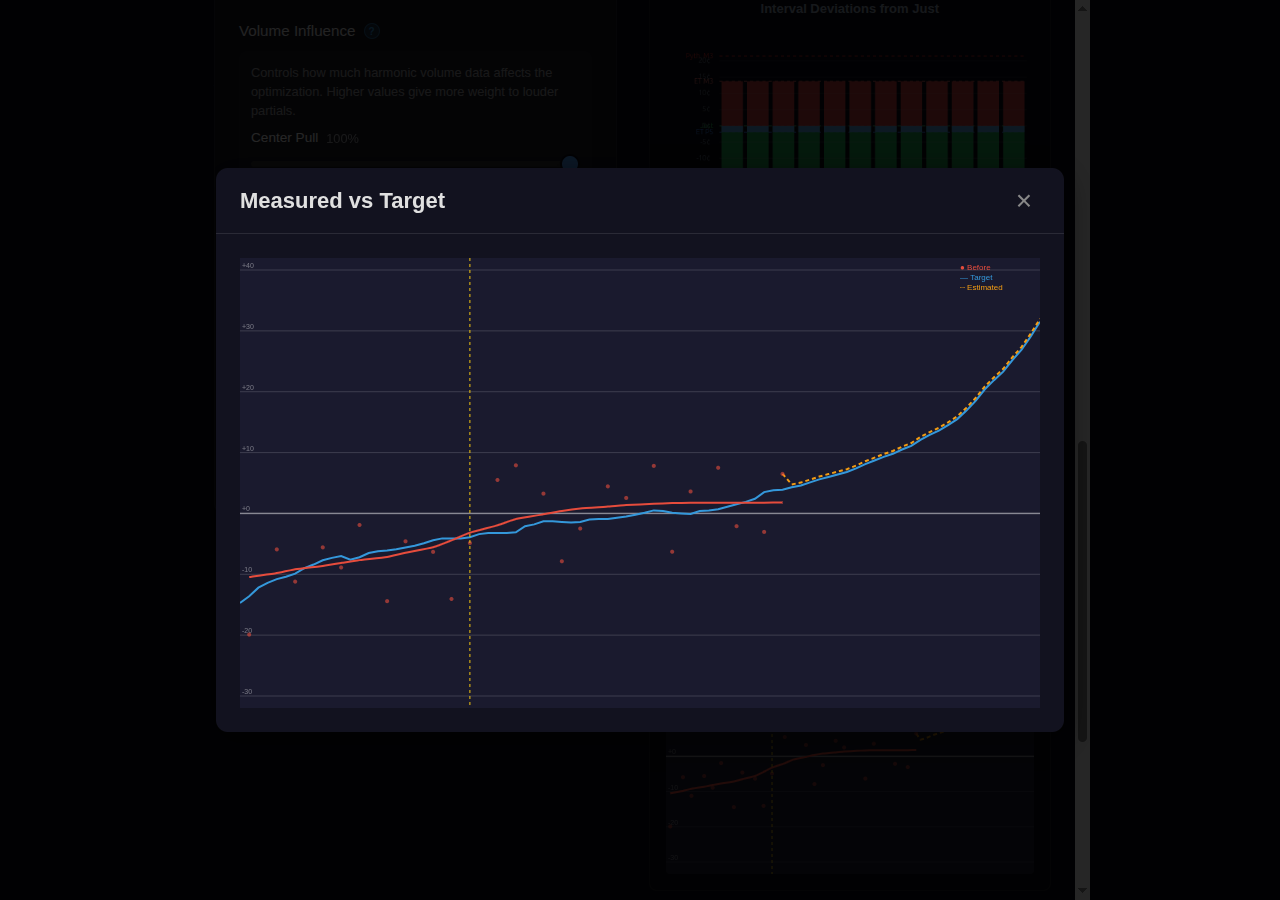
Overlays the piano's current tuning state against the optimized target curve, showing exactly how much work is needed to achieve the target.
- Red curve with dots — Current (before) tuning state, smoothed through measured points
- Blue curve — Target tuning curve
- Orange dashed line — Estimated treble state (for unmeasured notes, assumes average deviation from target)
- Yellow dashed line — Break point
The vertical gap between curves at any point shows the cents adjustment needed for that note. A piano that's uniformly flat will show parallel curves; uneven tuning shows varying gaps.
Pre-Tuning State (Expanded)
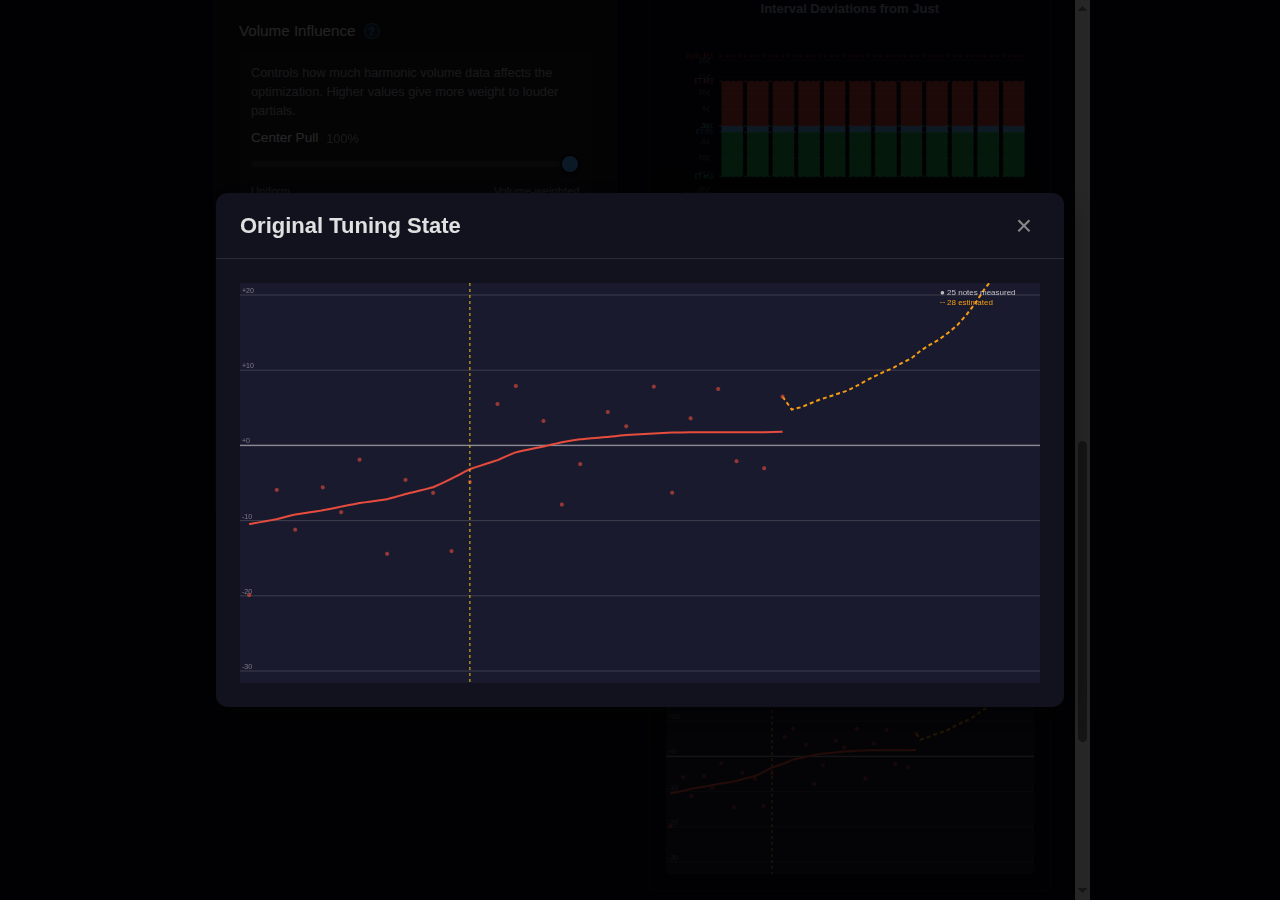
Shows where the piano was before you started—the raw measured pitch of each note relative to Equal Temperament at your reference pitch.
- Red curve with dots — Measured pre-tuning state (smoothed trend line)
- Orange dashed line — Estimated treble continuation (for unmeasured notes)
- Zero line — Equal temperament at reference pitch
- Note count — Shows how many notes were directly measured vs estimated
This chart reveals the piano's condition: uniformly flat pianos show a horizontal line below zero; pianos with varying pitch show irregular curves. The break point often shows a discontinuity where string characteristics change.
Work Required / Deviation (Expanded)
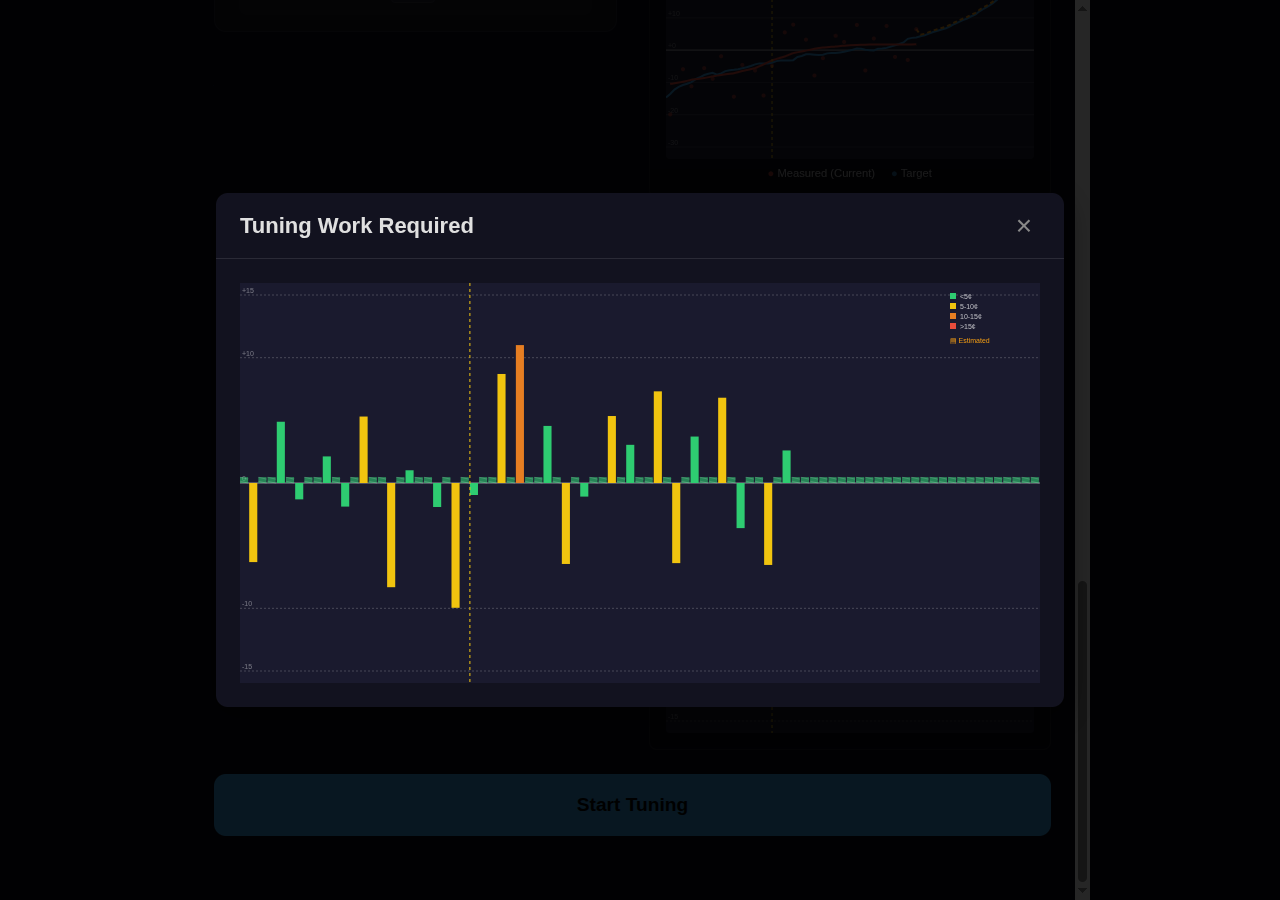
Bar chart showing how many cents each note needs to be adjusted. Positive bars (above zero) indicate notes that are sharp and need to be lowered; negative bars (below zero) indicate flat notes needing raising.
- Green bars — Minimal work needed (<5¢ deviation)
- Yellow bars — Moderate adjustment (5-10¢)
- Orange bars — Significant adjustment (10-15¢)
- Red bars — Major work needed (>15¢)
- Hatched bars — Estimated (unmeasured notes assumed to have average deviation)
Use this chart to identify problem areas before you start tuning. Clusters of red bars indicate sections needing extra attention; isolated red bars may indicate individual problem strings.
Interval Deviations (Expanded)
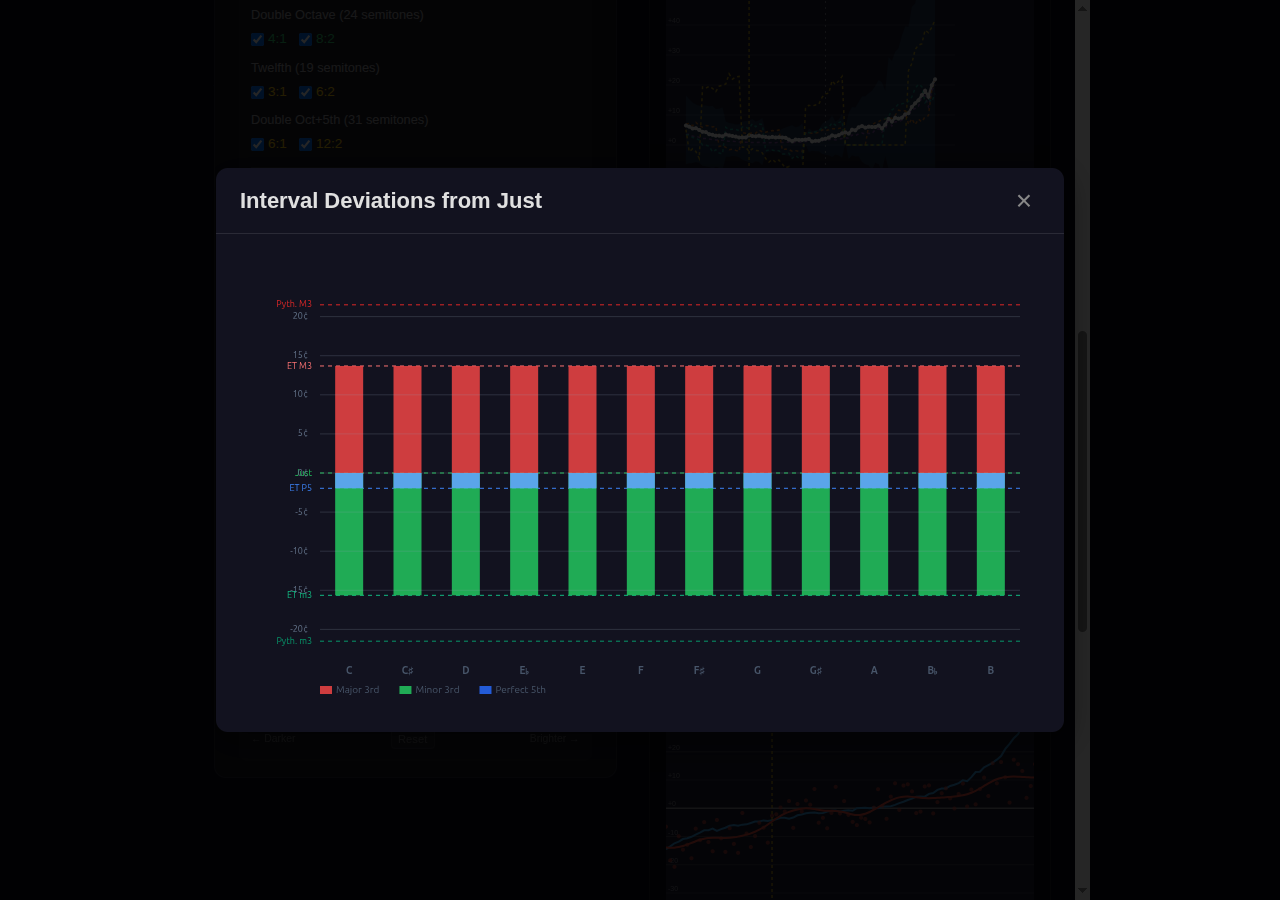
Visualizes the selected temperament's intervallic character. See Custom Finalization for detailed element descriptions. Note: this chart shows the selected temperament's interval qualities, not the piano's current state—it's the same whether you choose Equal Temperament, Kirnberger III, or another temperament.
Controls
| # | Control | Description |
|---|---|---|
| 1 | Temperament | Select from Equal Temperament or historical temperaments. Your measured inharmonicity is combined with the selected temperament. |
| 2 | Balance | Adjusts optimization weighting between octave purity and interval smoothness. |
| 3 | Start Tuning | Generate the final curve using your measured data and proceed to tuning. |
Temperament Selection
The temperament selector determines how intervals are distributed across the keyboard. This affects the "color" of different keys. Choose from built-in temperaments (Equal, Kirnberger III, Vallotti, Werckmeister III, Young, and more), or import custom temperaments via .scl (Scala) files.
Note: For standard modern piano tuning, Equal Temperament is recommended. Historical temperaments like Kirnberger III or Vallotti provide distinct key colors suited for Baroque and Classical repertoire.
Interval Deviations Chart
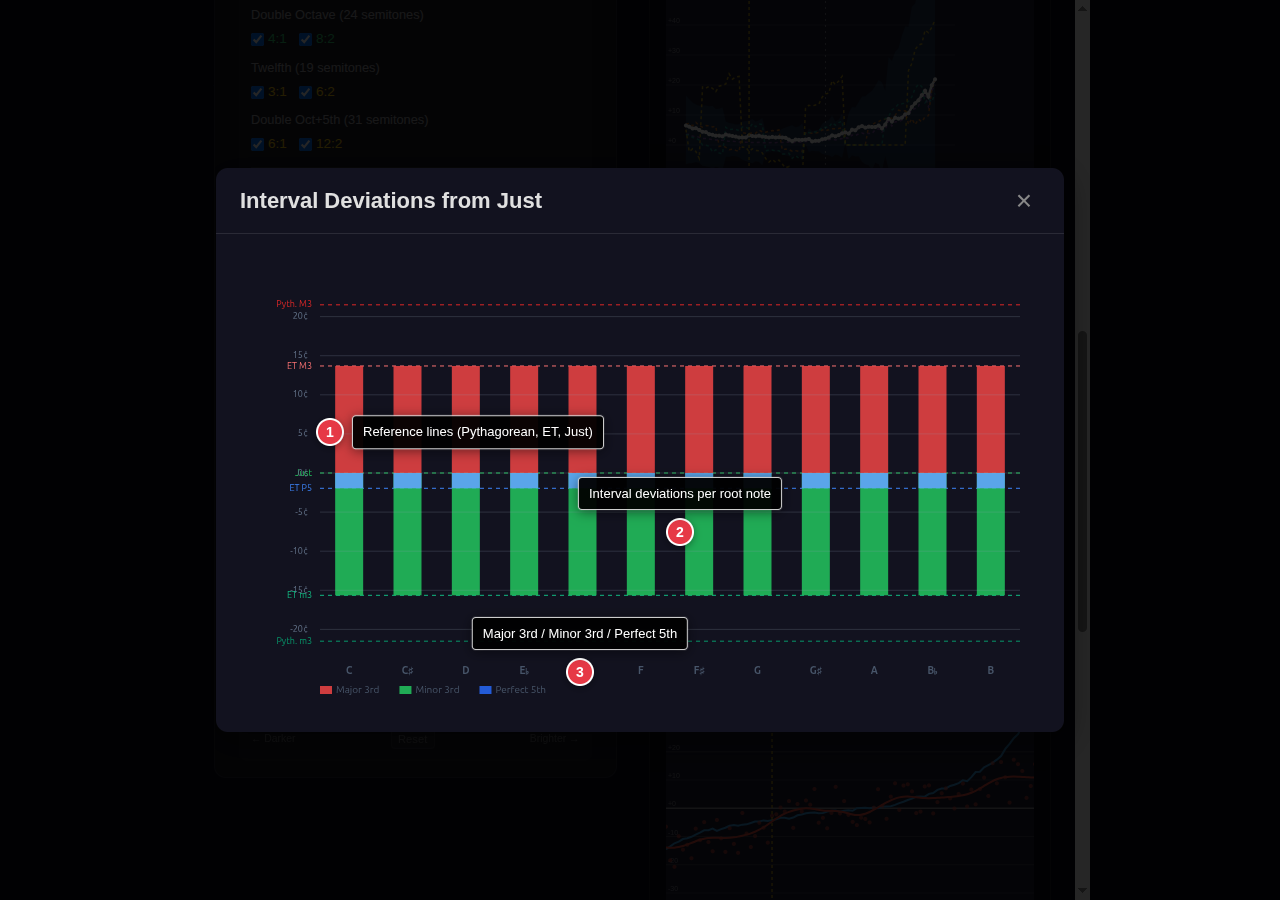
This chart visualizes the selected temperament's intervallic character—how major thirds, minor thirds, and perfect fifths deviate from pure just intonation for each root note. It reveals the "color" of different keys in historical temperaments (e.g., Kirnberger III has pure thirds in some keys and wider thirds in others), or shows the uniform distribution in Equal Temperament.
- Red bars — Major third deviation (positive = wider than just 5:4)
- Green bars — Minor third deviation (negative = narrower than just 6:5)
- Blue bars — Perfect fifth deviation (typically near zero)
Advanced Settings
The Advanced panel provides fine-grained control over the optimization algorithm:
Coincidences
Select which interval coincidences the optimizer should target. Presets: Full ET (all coincidences), Historical (fifth-related emphasis), Octaves Only (2:1, 4:2).
Beat Rate Smoothing
Enable smoothing for M3, P5, M6, or M10 intervals to create progressive beat rates as you move up the keyboard.
Volume Influence
Controls how much measured harmonic volumes affect optimization. At 100% (Volume-weighted), louder partials have more influence. At 0% (Uniform), all partials are weighted equally.
Voicing Adjustments
Fine-tune the stretch curve in five register zones: Low Bass, High Bass, Break→A4, A4→A6, A6→C8. Positive values brighten (more stretch), negative values darken (less stretch).
Tuning Path
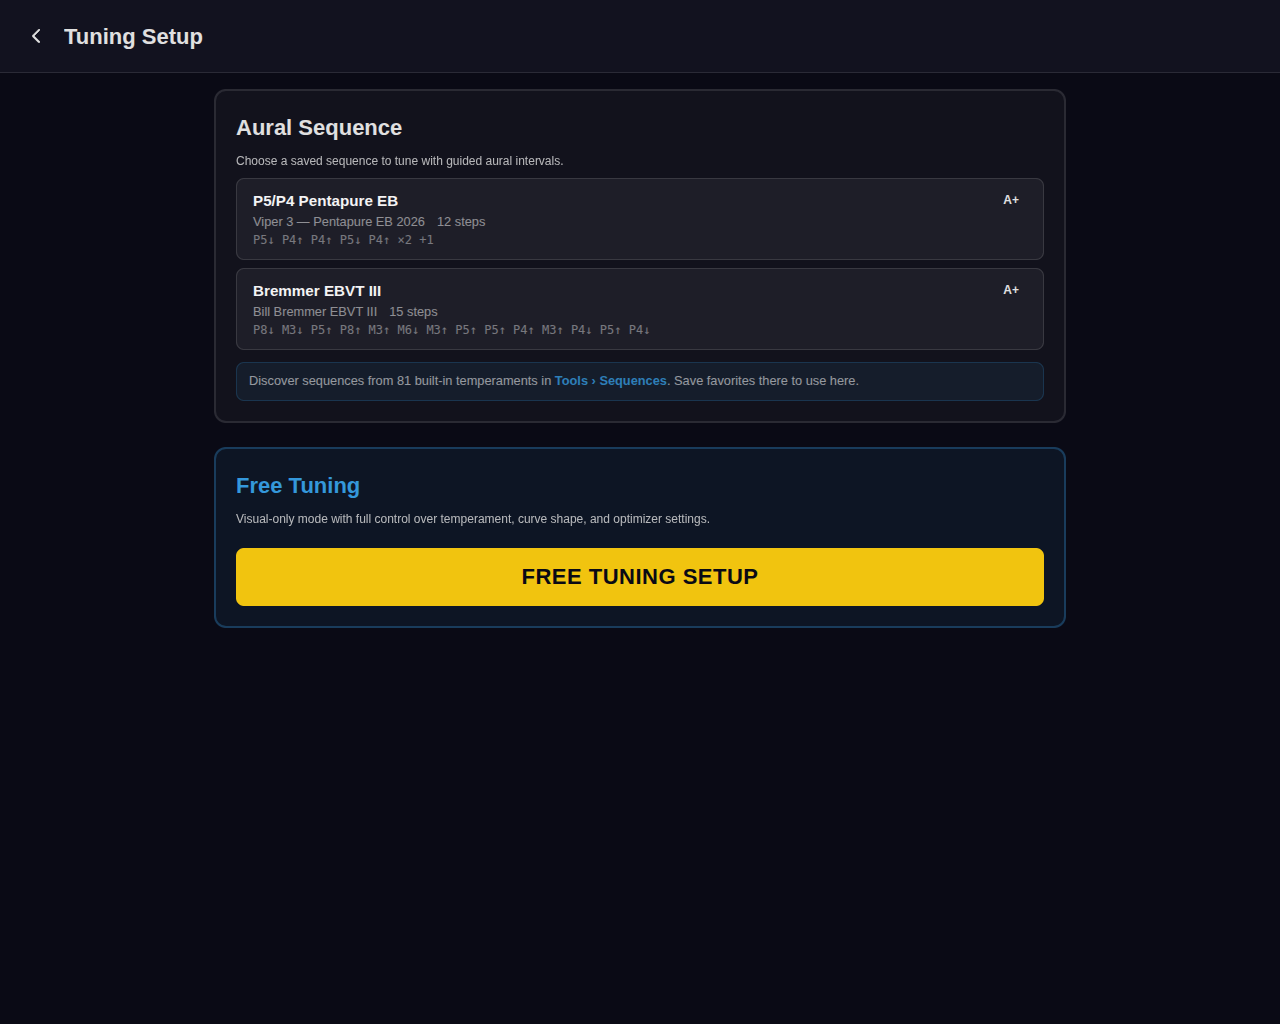
After Measure finalization generates your tuning curve, you choose how to proceed:
| # | Path | Description |
|---|---|---|
| 1 | Free Tuning | Go directly to the tuning screen. Navigate notes freely, use auto-switch, and tune with the measured curve as your guide. Best for most situations. |
| 2 | Aural Sequence | Follow a guided aural sequence (temperament setting + octave expansion) with the measured curve providing visual confirmation. Best for technicians who prefer the aural approach or want to cross-check their ear against measured data. |
Note: Aural sequences can also be started from the Tools menu on the home screen without measuring first—the same tools work with both workflows.
Aural Temperament Workflow
Access aural temperament setting from Tools > Sequences on the home screen, or by choosing "Aural Sequence" at the Tuning Path fork after Measure finalization. The guided workflow walks you through setting the temperament octave (F3–F4) using traditional interval techniques.
Available Temperaments
- Equal Temperament — Standard 12-tone ET using M3 and M6 intervals with progressive beat rates (7→9→11→14 bps ladder).
- EBVT Victorian — Bill Bremmer's Equal Beating Victorian Temperament with 24 distinct key characters. Uses "copy, don't count" technique where only one beat rate (6 bps) is counted.
- EBVT III — A third variation of the Equal Beating Victorian Temperament series.
REF Steps
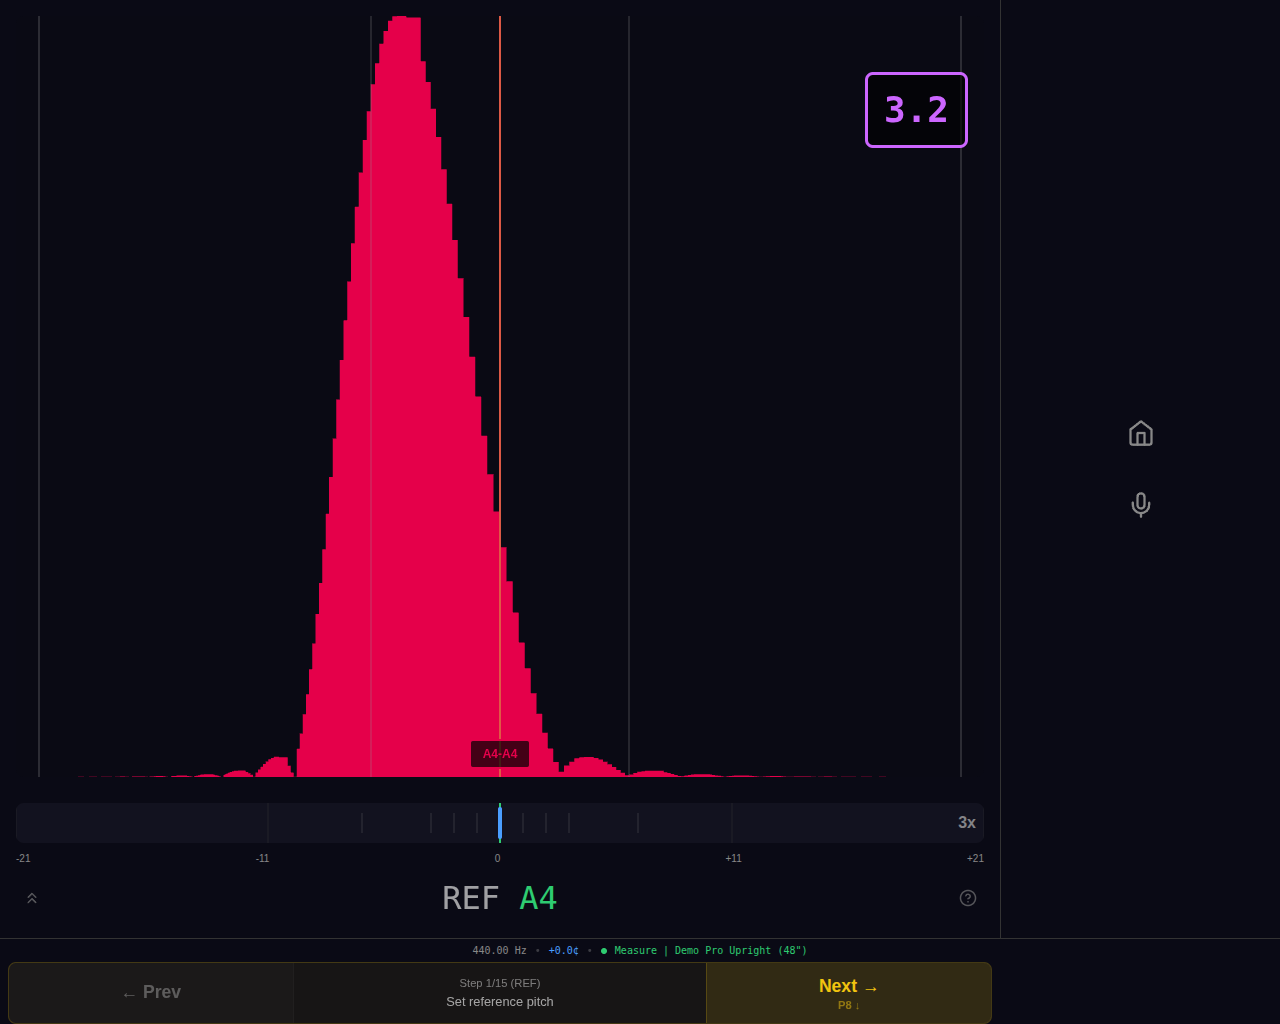
Each sequence begins with a REF step that establishes the reference pitch. The TemperamentRenderer shows the coincident partial spectrum. The nav bar displays the current note, step type (REF), and prev/next controls to move through the sequence. Progress is saved automatically.
TUNE Steps
TUNE steps are where you adjust a note to create the correct interval relationship. The display overlays coincident partials from both the target and anchor notes, showing exactly where the beat interaction occurs. The nav bar shows the target beat rate for the current interval. Tune until the audible beat rate matches the target.
CHECK Overlay
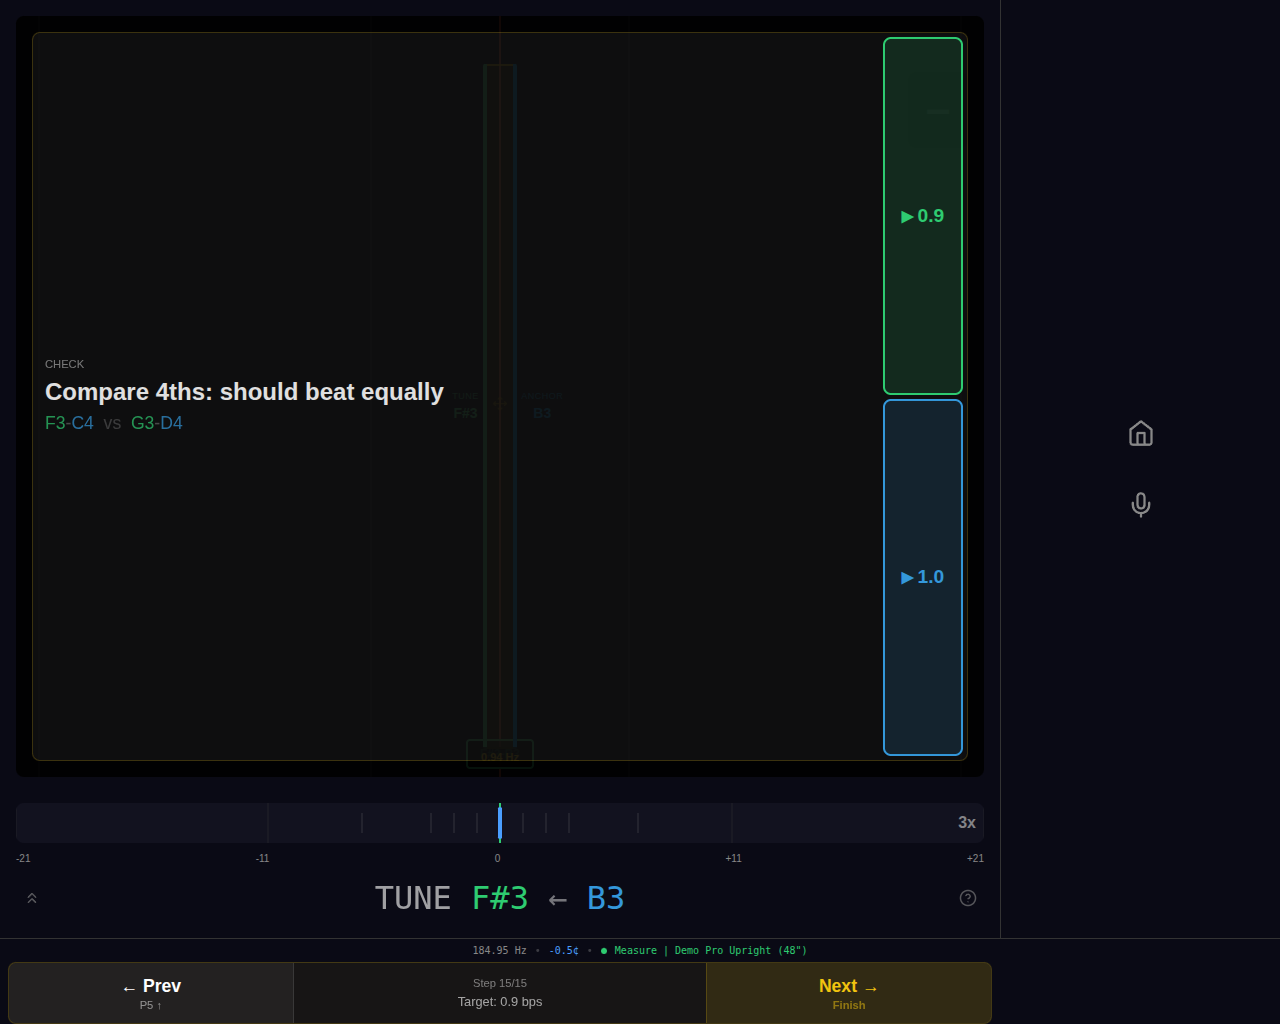
CHECK steps verify that your tuning is consistent. The overlay presents interval pairs with play buttons for synthesized reference tones. Compare each pair aurally—for ET, the classic ladder check verifies M3 intervals beat progressively faster: F3–A3 (~7) → A3–C#4 (~9) → C#4–F4 (~11) → F4–A4 (~14). If an interval sounds wrong, go back and adjust.
Workflow Phases (Equal Temperament)
Phase 1: M3 Ladder Foundation — Start with A4 reference (440 Hz), set A3 as beatless octave, then build the characteristic M3 ladder: F3–A3 (~7 bps), A3–C#4 (~9 bps), C#4–F4 (~11 bps), and verify F4–A4 (~14 bps).
Phase 2: M6s Descending + E4 — Use M6 intervals to fill in C4, E4, F#4, G#3, and D4. M6 intervals beat at approximately 8–12 bps in this range.
Phase 3: M3 Chain to Complete — Complete the chromatic scale using alternating M3 and M6 intervals: A#3, F#3, D#4, B3, and G3. Final check: play chromatic F3–F4.
Tip: The visual display shows coincident partials, but your ears are the final judge. Listen for the characteristic beat rate specified for each interval. The display provides confirmation but should not override what you hear.
Aural Octave Expansion
After setting the temperament octave (F3–F4), expand the tuning to the full keyboard using aural octave techniques. This phase uses partial matching to tune each octave while maintaining the character established in the temperament.
Octave Expansion Interface
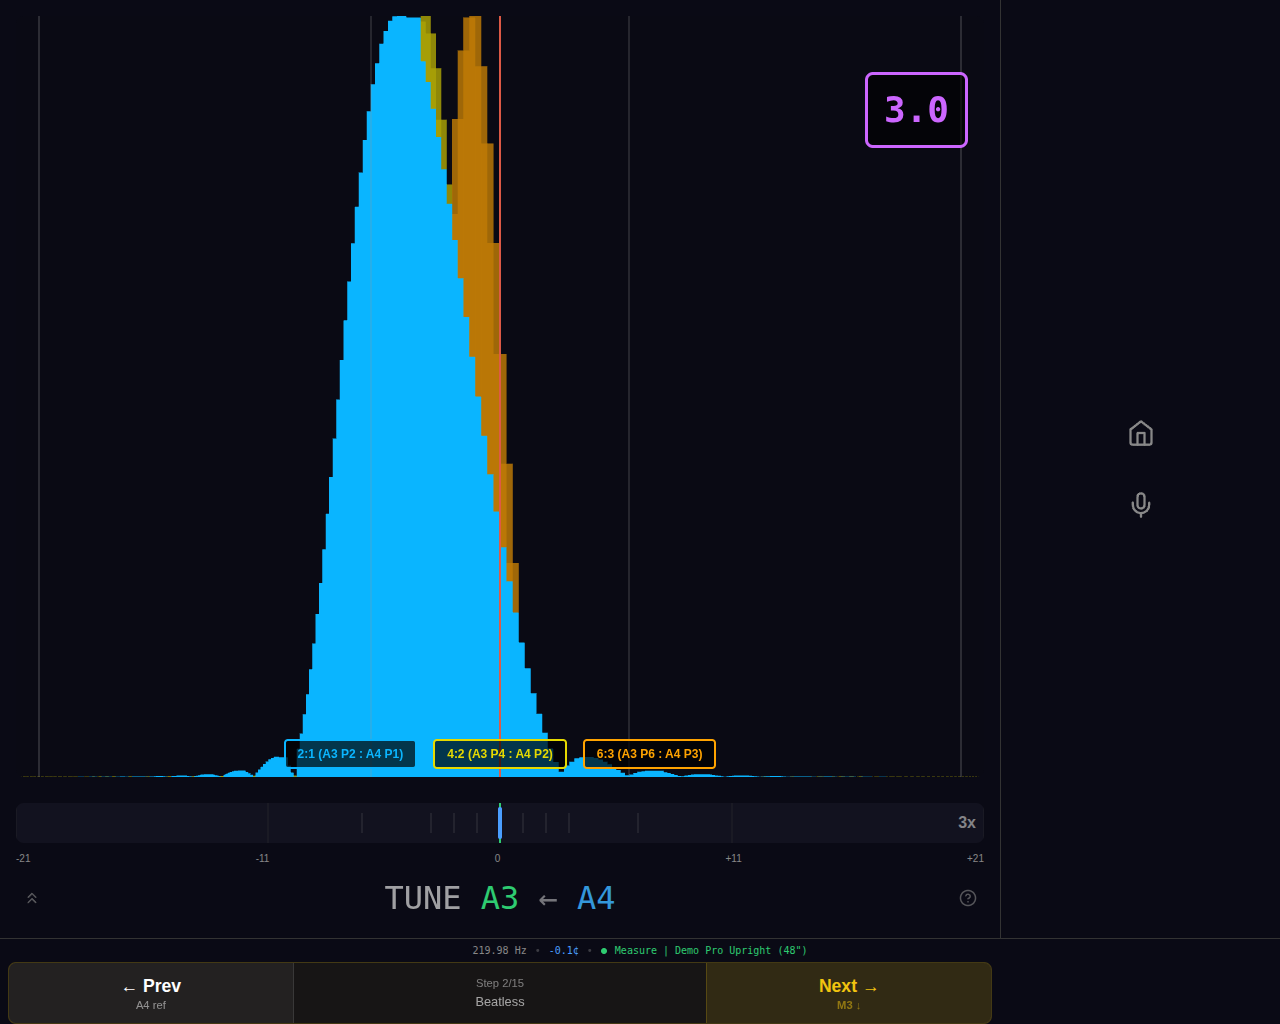
The display shows overlaid partials with labels identifying each partial number and its reference note. Standard nav controls (prev/next note, prev/next octave) let you move freely across the keyboard. Which partials appear depends on the register:
Bass Register
In the bass, multiple partials (P2, P3, P4, P6, P8) are displayed because low notes have rich harmonic content. Tune by matching these partials to the corresponding temperament notes:
- P2 — One octave above the fundamental
- P3 — Twelfth (octave + fifth) above
- P4 — Two octaves above
- P6 — Two octaves + fifth above
- P8 — Three octaves above
Tip: In the bass, inharmonicity causes higher partials to be progressively sharper. A "beatless" octave may actually have the upper note slightly flat to compensate. Listen for the smoothest overall sound rather than eliminating all beats.
High Treble Register
In the high treble, only partials 1 and 2 are displayed because high notes have minimal harmonic content—the fundamental dominates. Treble tuning relies more on octave relationships with the temperament notes below.
Note: High treble notes (above C7) are difficult to tune aurally due to limited harmonic content. Many technicians use octave-and-a-half or double-octave checks, listening for smooth progression rather than perfect unisons. The visual display can help confirm pitch when partials are hard to hear.
Completion
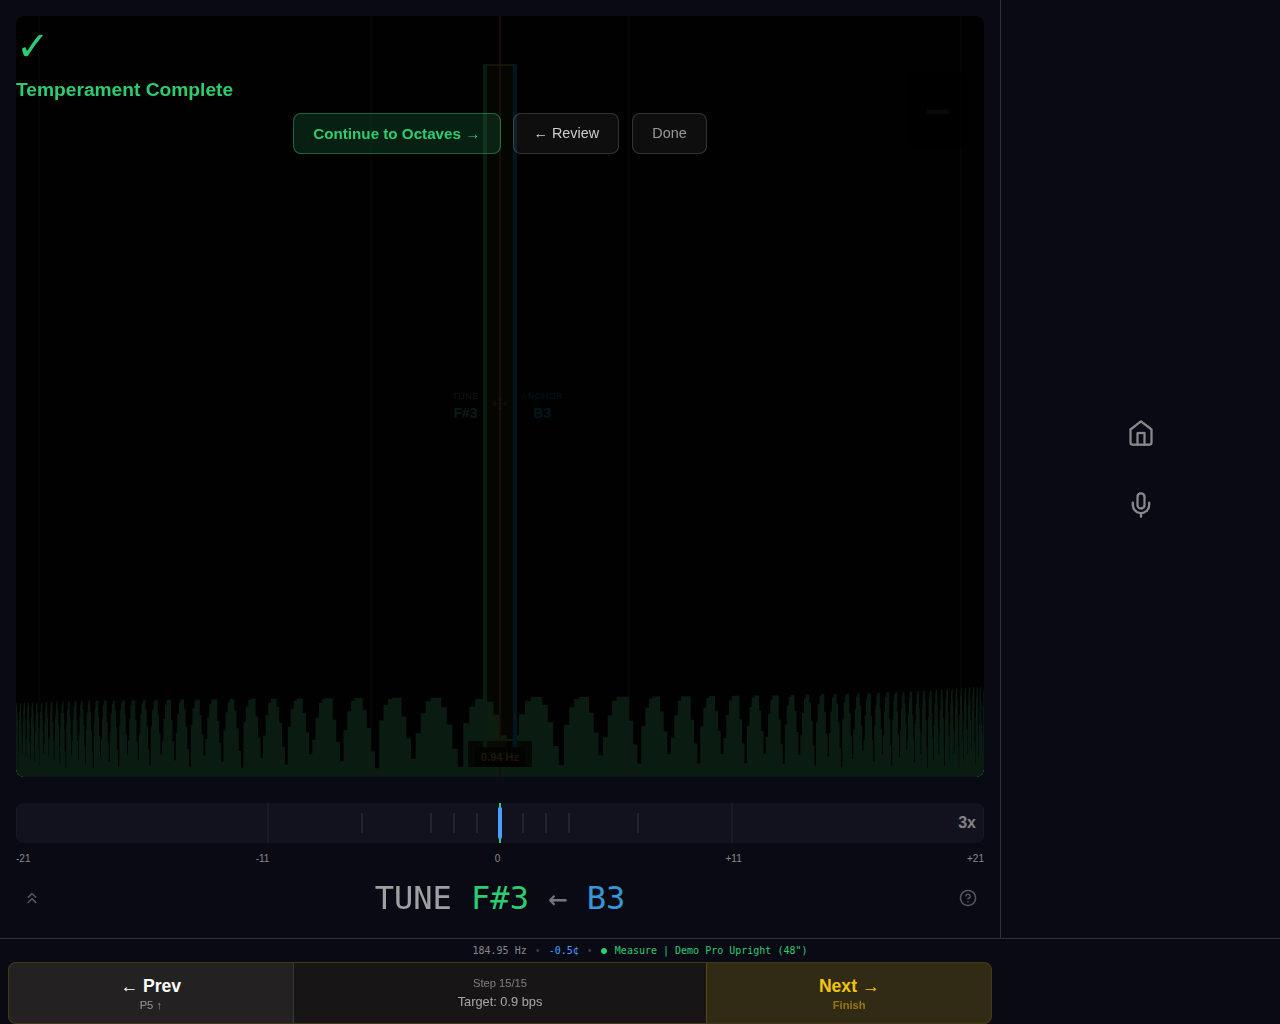
When you reach the end of the expansion sequence, a completion overlay appears with options to continue tuning freely, review previous steps, or finish the session.
Tuning Screen
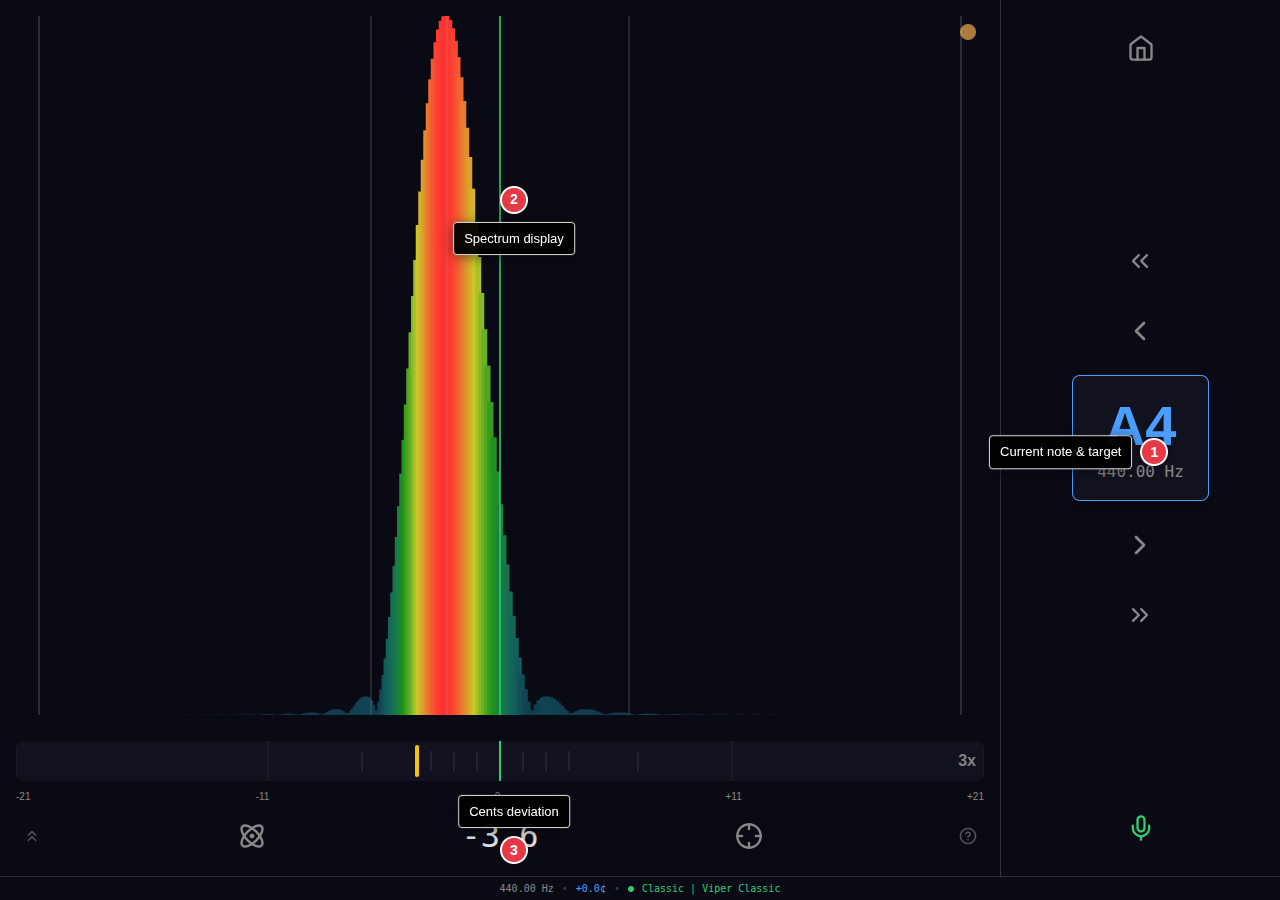
| # | Area | Description |
|---|---|---|
| 1 | Current note & target | Displays the selected note name (e.g., A4) and its target frequency in Hz. |
| 2 | Visualization area | Displays the currently selected visualization mode. Ten modes are available (see Visualization Modes). Use the prev/next viz buttons to switch modes. |
| 3 | Cents deviation | Numerical readout showing how many cents the detected pitch is from the target. Negative = flat, positive = sharp. |
Navigation Controls
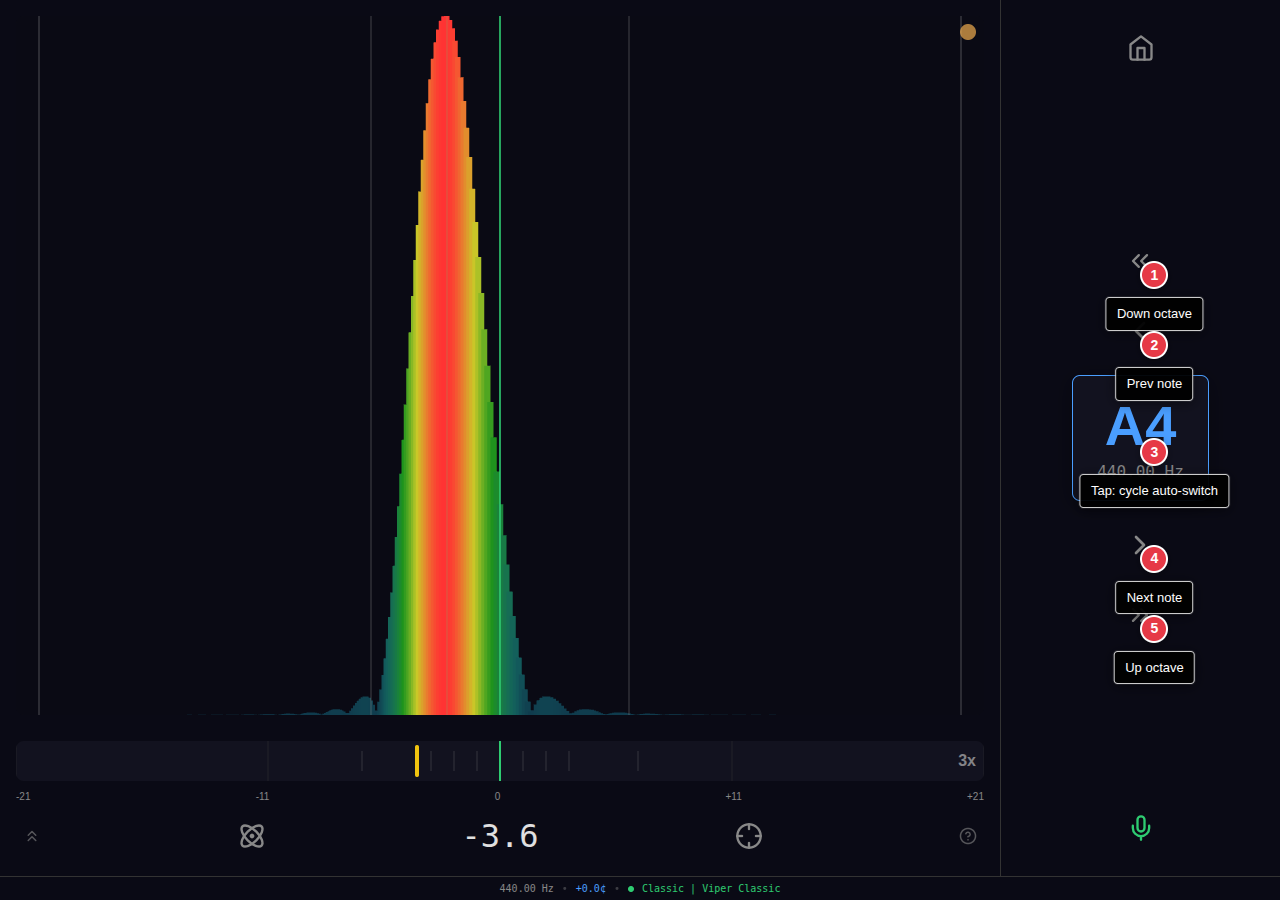
| # | Control | What It Does |
|---|---|---|
| 1 | Down octave | Moves 12 semitones lower. Stops at A0 (MIDI 21). |
| 2 | Prev note | Moves 1 semitone lower. |
| 3 | Tap: cycle auto-switch | Tapping the note display cycles through auto-switch modes: OFF → UP → DOWN → BOTH → OFF. See Auto-Switch section. |
| 4 | Next note | Moves 1 semitone higher. |
| 5 | Up octave | Moves 12 semitones higher. Stops at C8 (MIDI 108). |
Canvas Tap Zones
The spectrum canvas is divided into four tap zones for quick navigation without reaching for buttons.
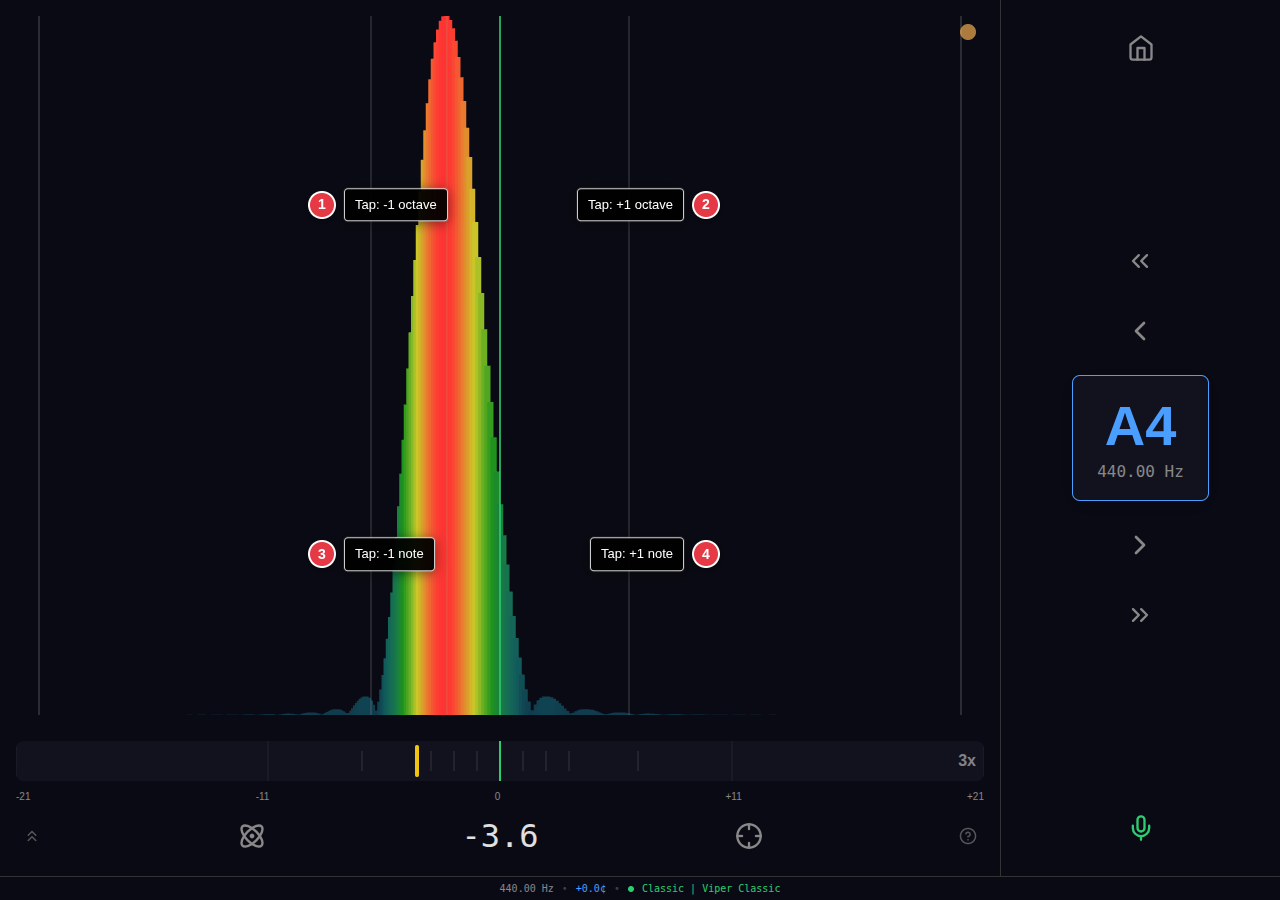
| # | Zone | What It Does |
|---|---|---|
| 1 | Tap: -1 octave | Top-left quadrant. Moves 12 semitones lower. |
| 2 | Tap: +1 octave | Top-right quadrant. Moves 12 semitones higher. |
| 3 | Tap: -1 note | Bottom-left quadrant. Moves 1 semitone lower. |
| 4 | Tap: +1 note | Bottom-right quadrant. Moves 1 semitone higher. |
Note: A brief highlight appears when a zone is tapped.
Utility Controls
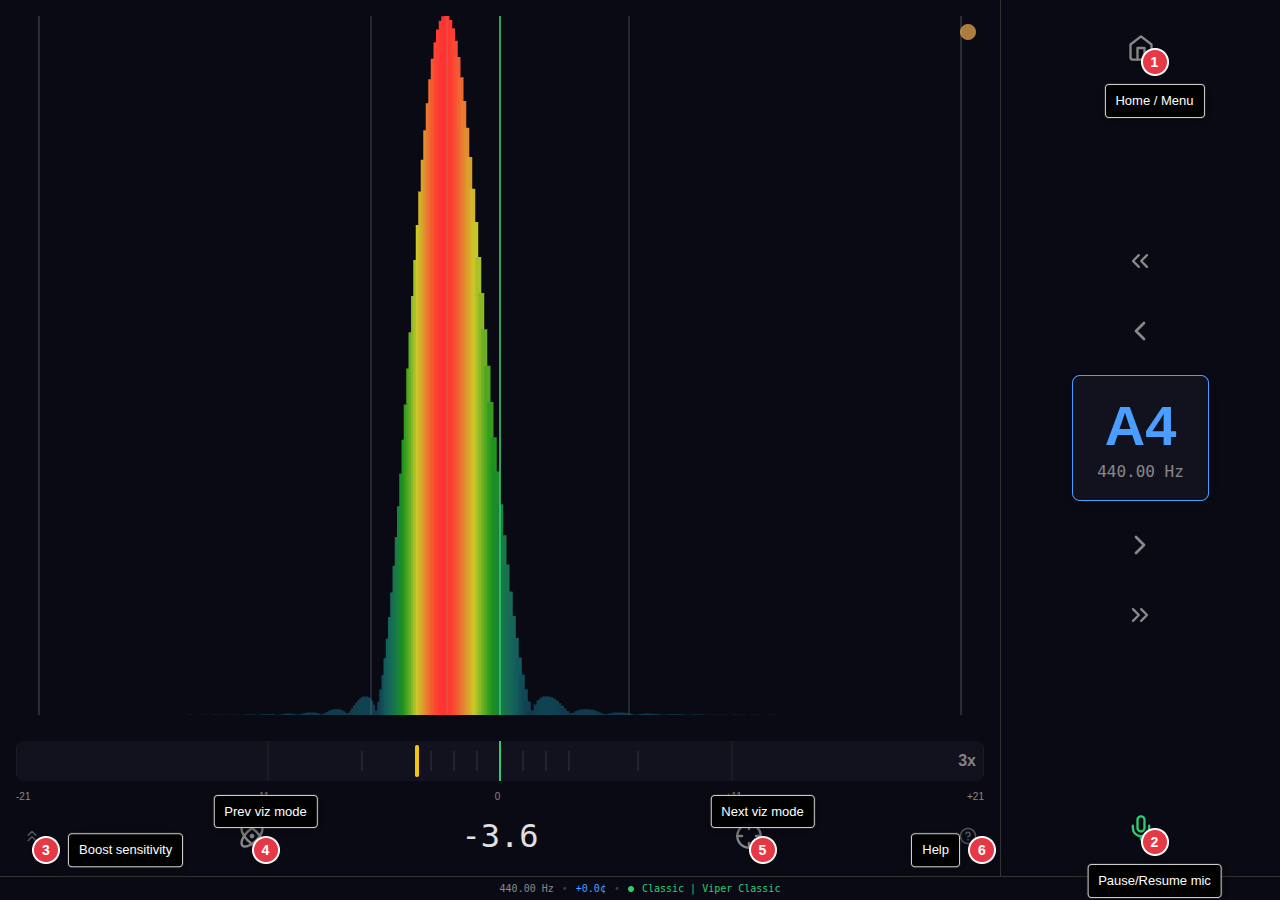
| # | Control | What It Does |
|---|---|---|
| 1 | Home / Menu | Returns to the home screen. |
| 2 | Pause/Resume mic |
Toggles microphone capture on/off. The icon color indicates status:
Tip: If the microphone stops responding (common on mobile after backgrounding the app), tap this button to restart audio capture. |
| 3 | Boost sensitivity | Halves the display envelope, making quieter signals more visible. Tap multiple times to continue boosting. The display resets when changing notes. |
| 4 | Prev viz mode | Switches to the previous visualization mode. The button icon shows which mode you'll switch to. |
| 5 | Next viz mode | Switches to the next visualization mode. The button icon shows which mode you'll switch to. |
| 6 | Help | Opens a help panel with information specific to the current visualization mode. |
Cents Bar & Zoom
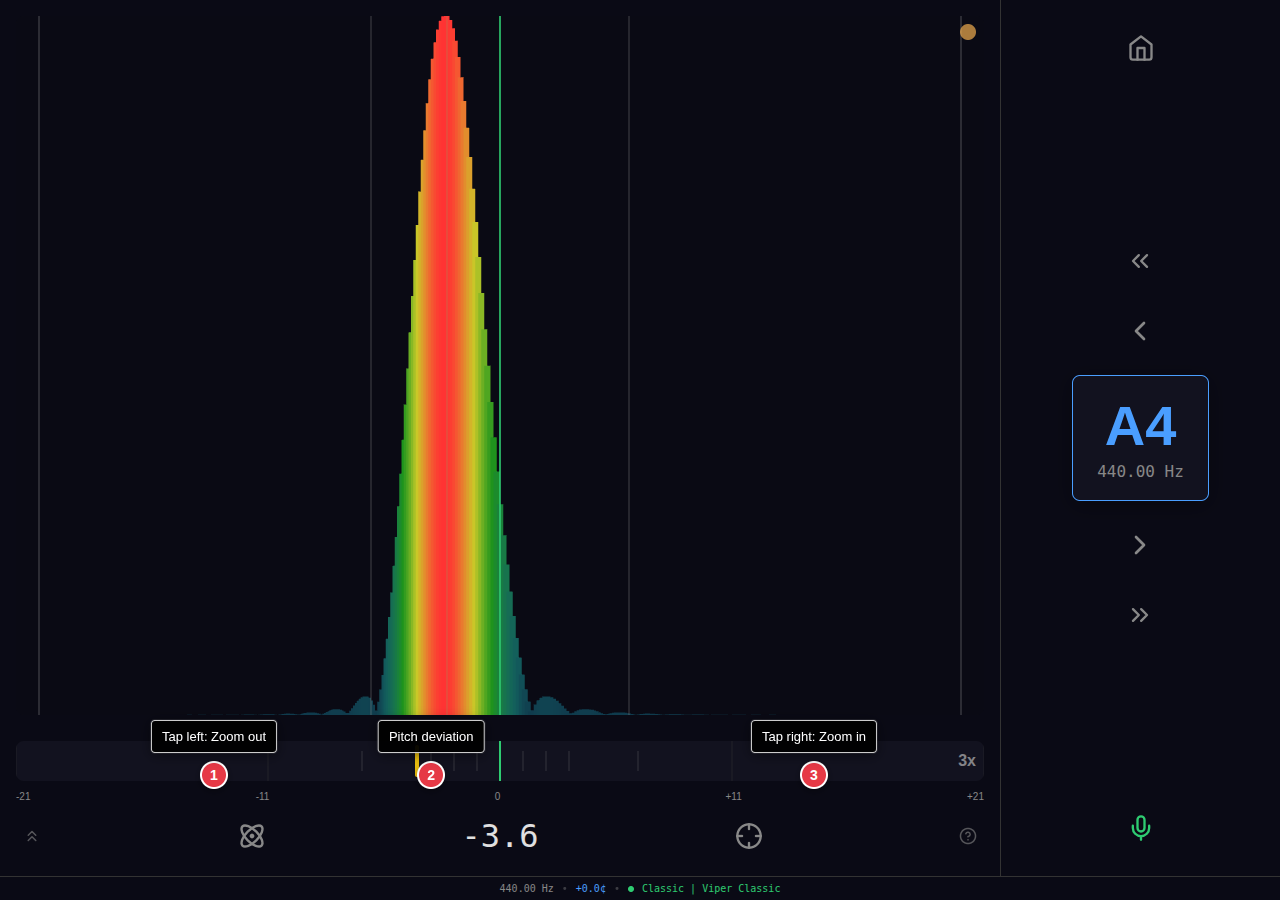
| # | Control | What It Does |
|---|---|---|
| 1 | Tap left: Zoom out | Decreases magnification or sensitivity of both the cents bar and visualization display. |
| 2 | Pitch deviation | The indicator bar shows current pitch offset from target. Color changes based on accuracy: green (within 2¢), yellow (within 10¢), red (beyond 10¢). |
| 3 | Tap right: Zoom in | Increases magnification or sensitivity of both the cents bar and visualization display. |
Zoom Levels
Five zoom levels are available. The current level is shown on the right side of the cents bar (e.g., "3x"). The effect of zoom varies by visualization mode.
| Level | Cents Bar | Effect |
|---|---|---|
| 1x | ±55 cents | Lowest magnification / sensitivity |
| 2x | ±34 cents | Light |
| 3x | ±21 cents | Default |
| 4x | ±13 cents | Higher |
| 5x | ±8 cents | Maximum magnification / sensitivity |
How Zoom Affects Each Mode
The cents bar always responds the same way: higher zoom = narrower displayed range (see table above). The visualization effect varies by mode:
| Mode | Visualization Behavior |
|---|---|
| Spectrum | Applies fisheye distortion. The full ±120 cent range is always visible, but the center is magnified and edges compressed. Higher zoom = stronger magnification at center. |
| Waterfall | Same fisheye distortion as Spectrum. History trails show the same magnification effect. |
| Aural | Same fisheye distortion as Spectrum, applied to all partial overlays. |
| PitchZone |
Fisheye distortion applied to the spectrum bars and zone boundaries.
Important: Zoom is centered on the overpull target area, not the general target frequency. This may appear different from other fisheye modes. |
| Concentric | Increases rotation sensitivity. Higher zoom = circles rotate more for the same pitch deviation. |
| Lissajous | Increases phase sensitivity. Higher zoom = figure responds more to small pitch changes. |
| Quantum | Zooms into the center of the arc display. Higher zoom = outer reference rings may disappear. |
| Railsback | No effect. The full piano range (A0–C8) is always displayed. |
Note: Zoom level is saved and restored between sessions.
Auto-Switch
Auto-switch automatically advances to the next (or previous) note when a strong signal is detected within ±65 cents of the adjacent note. Tap the note display to cycle through modes.
OFF
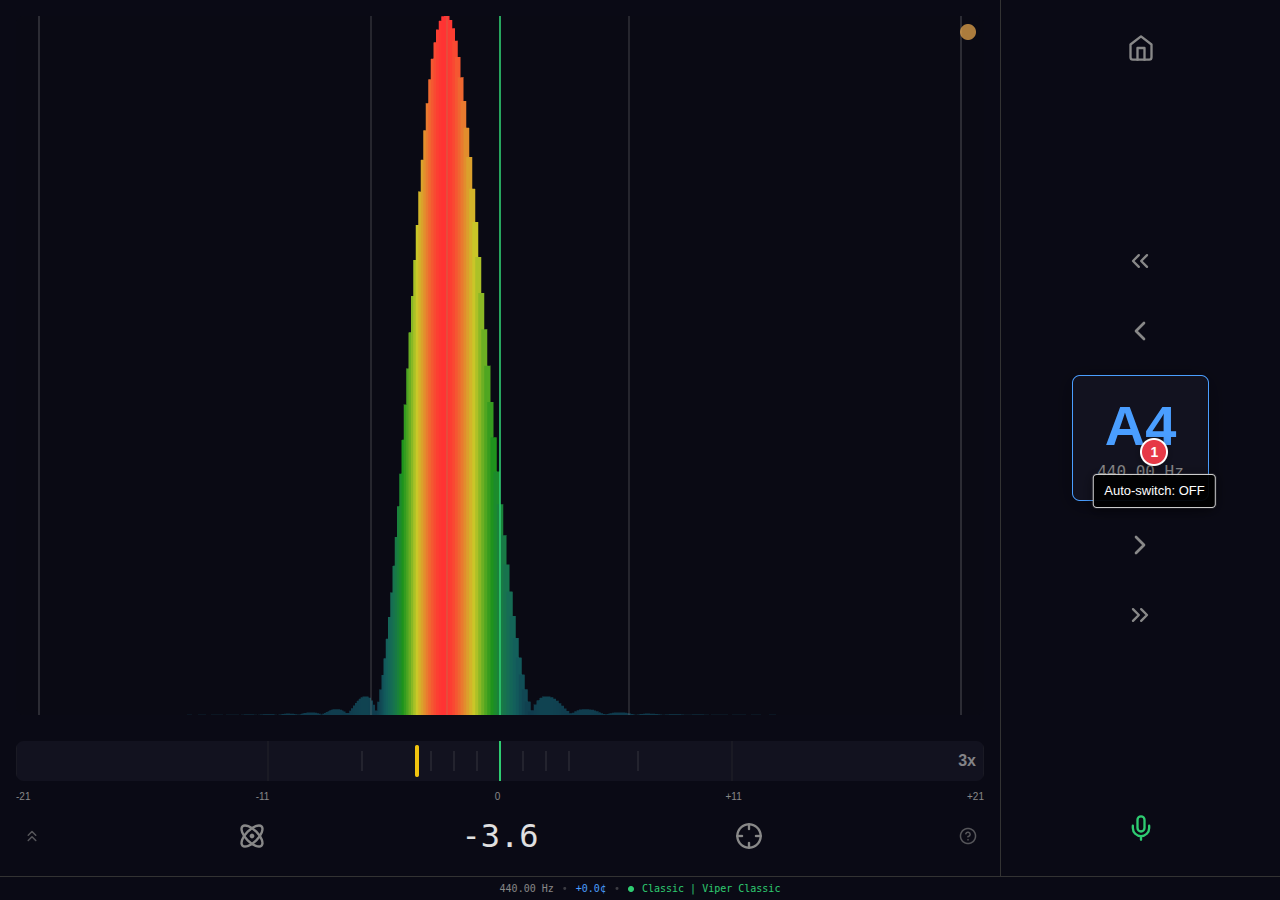
Manual note selection only. The app stays on the current note regardless of what is played.
UP
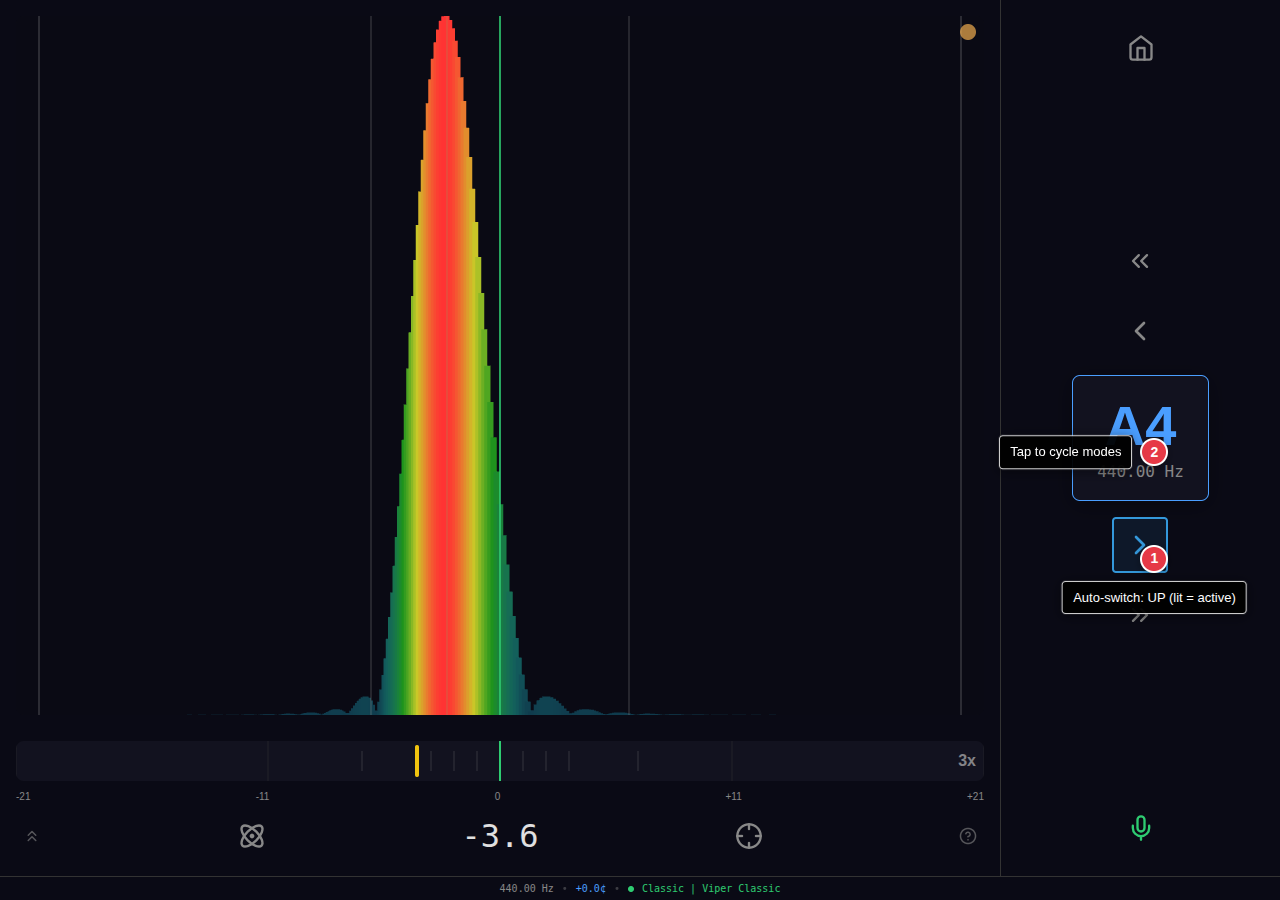
When a note one semitone higher is struck, the display advances to that note. The right arrow button shows a blue highlight when this mode is active.
DOWN
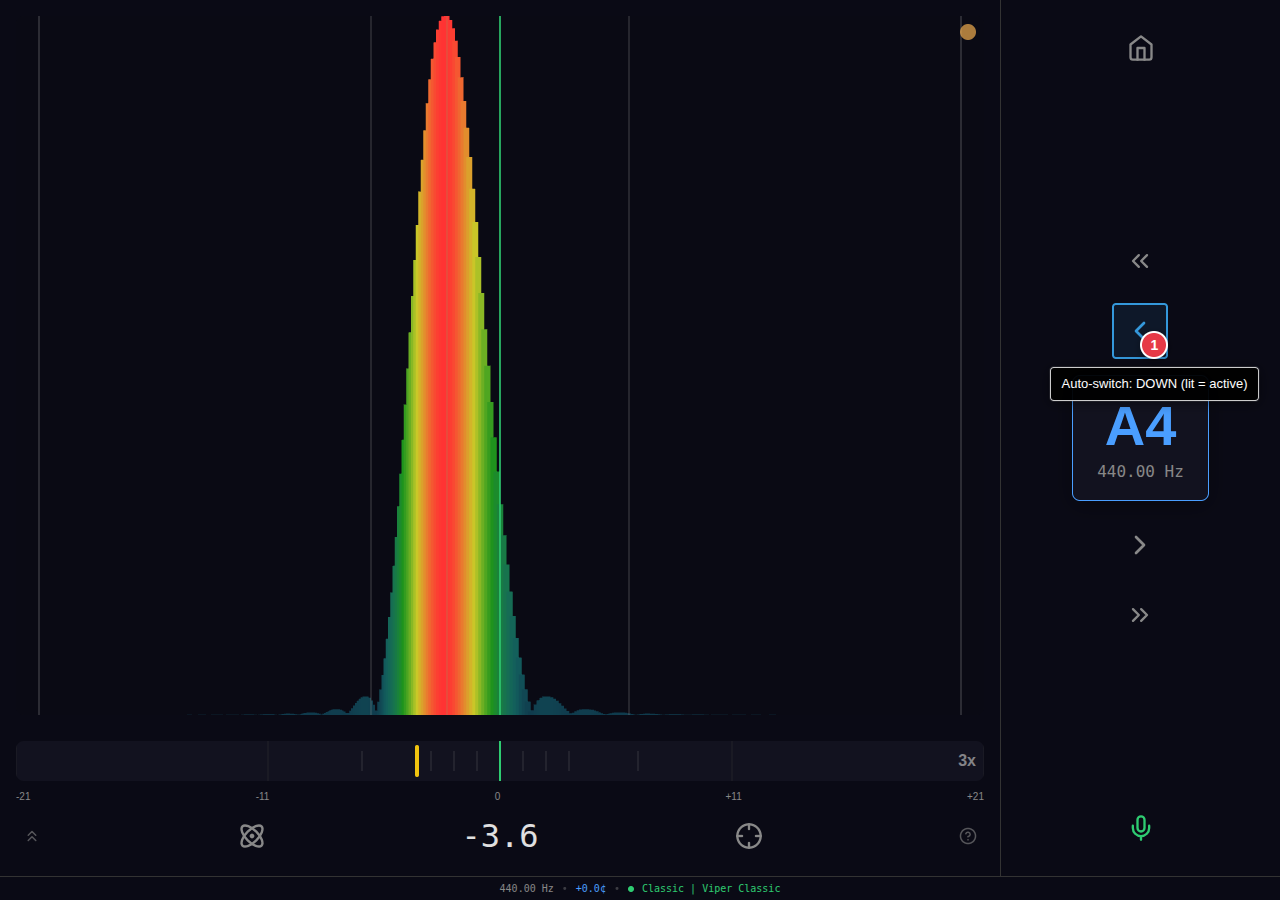
When a note one semitone lower is struck, the display moves to that note. The left arrow button shows a blue highlight when this mode is active.
BOTH
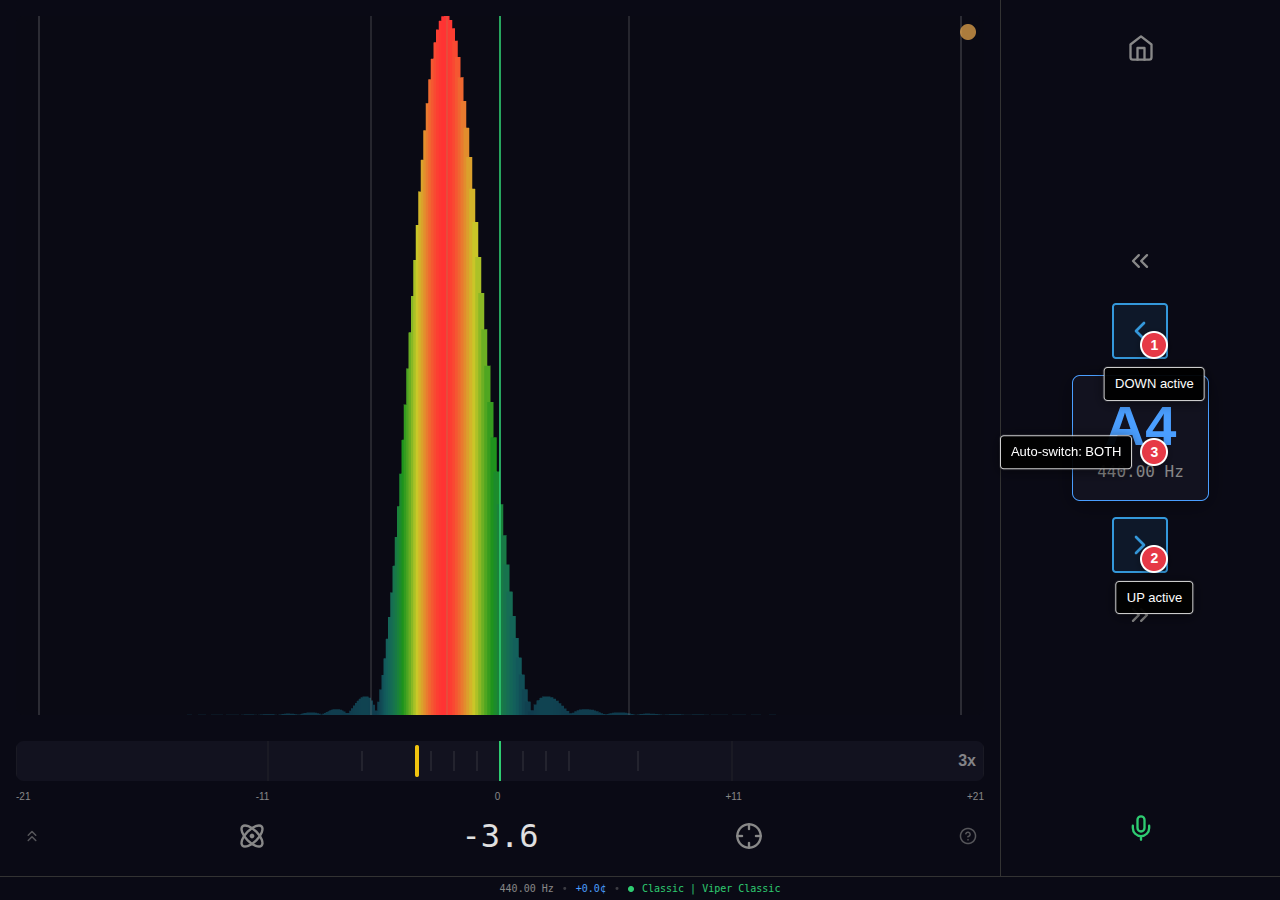
Responds to notes struck in either direction. Both arrow buttons show blue highlights.
Strike Line
The strike line is a magenta vertical indicator that appears at the moment of hammer impact, showing the pitch at the instant of the strike before the string settles to its steady-state frequency. This provides two key pieces of information:
- Initial pitch tracking — See exactly where the hammer pushed the string before it relaxes. Particularly useful during pitch raises where the initial overshoot matters.
- Strike history for reports — Each strike is recorded with its cents offset. The Tuning Report uses this data to calculate accuracy metrics and identify concerning notes.
Strike Indicator Dot
A small circular indicator in the upper-right corner of the visualization display shows the strike detection state:
- Gray — Waiting for a strike (idle)
- Yellow — Attack detected (hammer impact transient)
- Green — Monitoring steady state (measurement in progress)
Where It Appears
The strike line is visible in 6 of 10 visualization modes:
| Mode | Strike Line |
|---|---|
| Spectrum | Yes |
| PitchZone | Yes |
| Aural | Yes |
| Waterfall | Yes |
| Concentric | Yes |
| Geometric | Yes |
| Lissajous | No |
| Quantum | No |
| Railsback | No |
| IH Monitor | No |
Note: The strike line color (#FF00FF, magenta at 90% opacity) is chosen for maximum visibility against all visualization color schemes.
Visualization Modes
Viper Tuner provides ten visualization modes, each optimized for different tuning scenarios. Use the prev/next viz buttons to switch between modes.
Spectrum
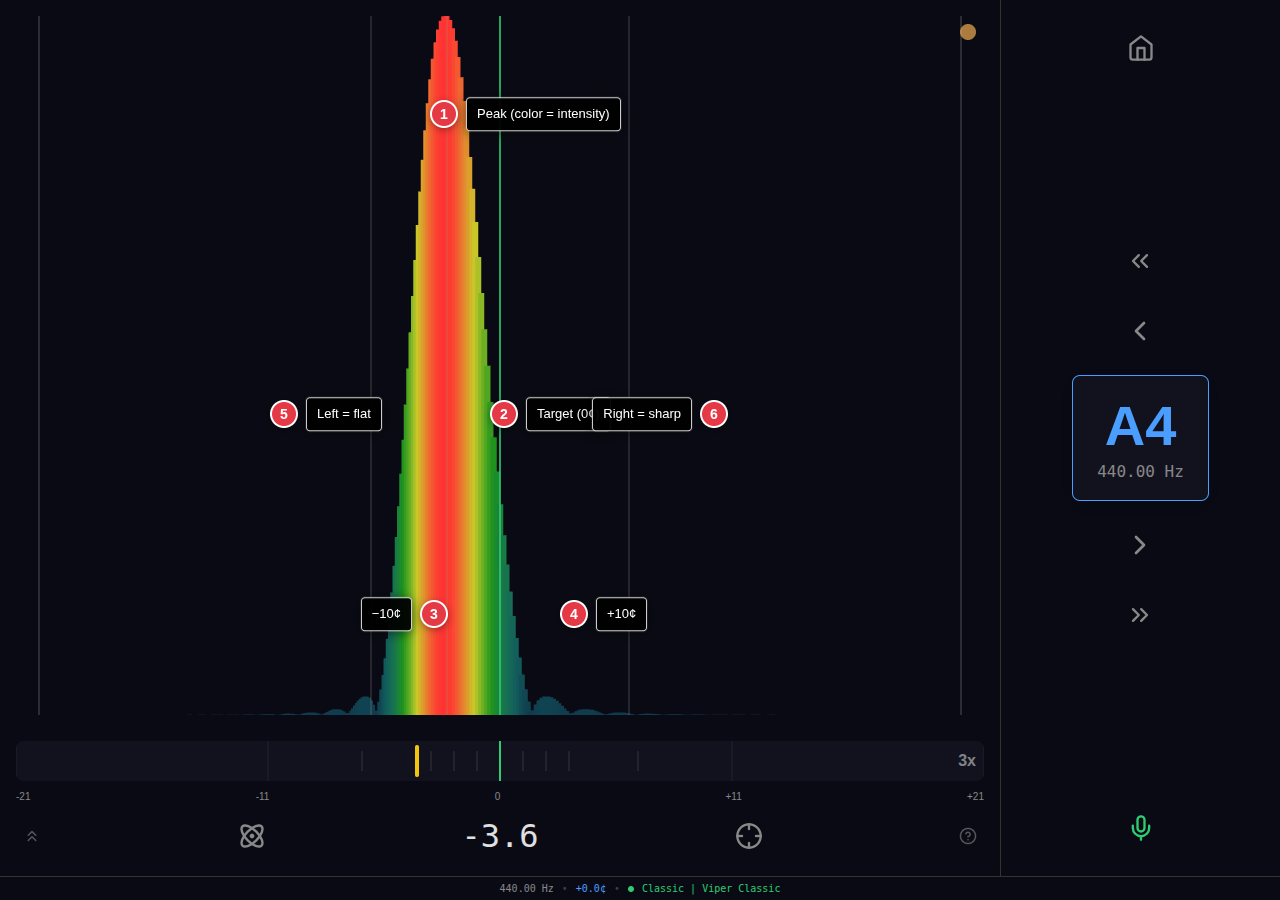
The primary tuning view. Displays the ZoomFFT spectrum as vertical bars spanning ±120 cents around the target pitch. A fisheye distortion magnifies the center region, making small deviations more visible while keeping the full range available.
How to use: Bring the spectrum peak to the center line. Left of center = flat, right = sharp. The indicator dot in the upper-right shows strike detection state: gray (waiting), yellow (attack detected), green (monitoring steady state). The cents bar below provides a numeric readout.
PitchZone
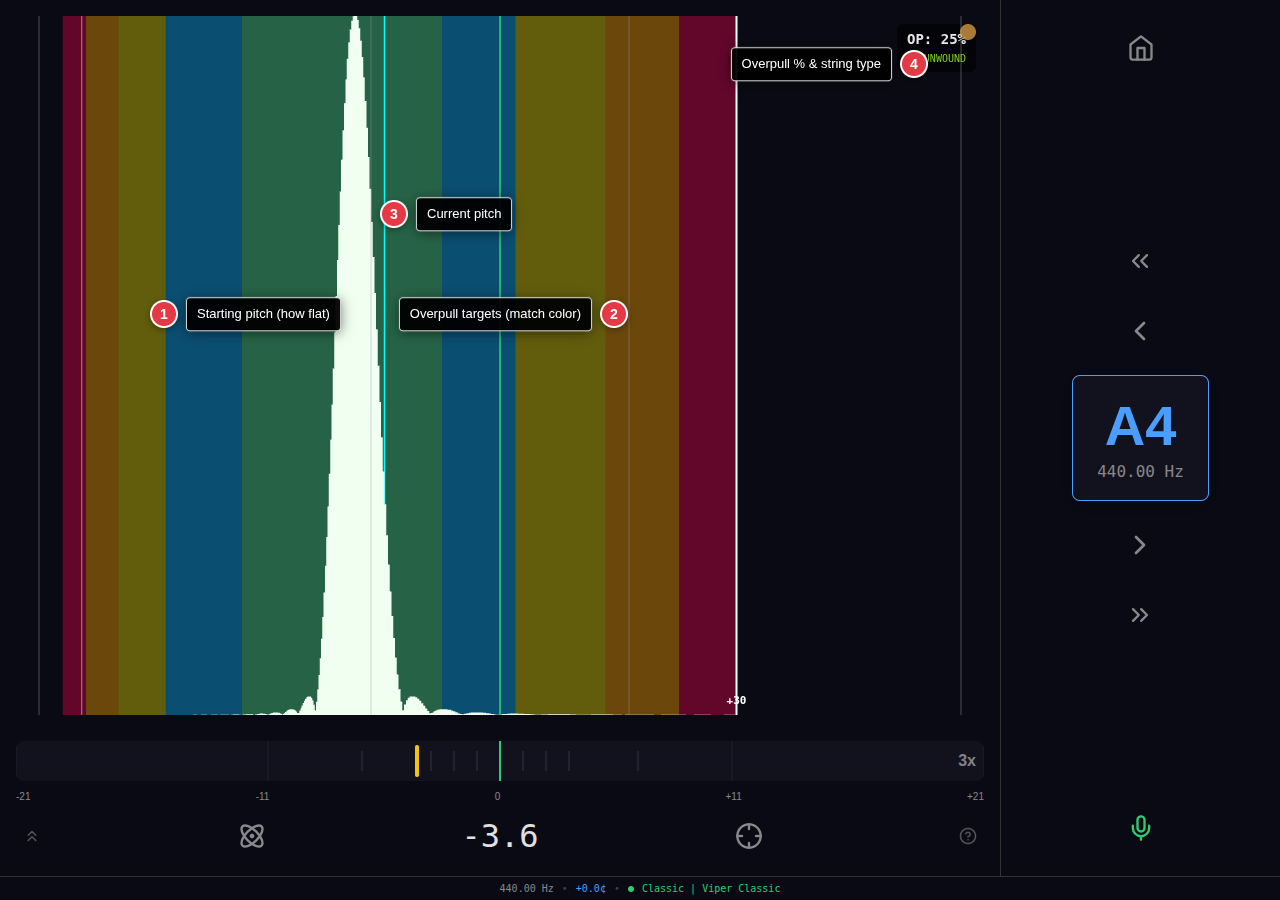
Designed specifically for pitch raises. The display is asymmetric: the left half shows how flat the note is (full 120-cent range), while the right half shows the overpull target zone (compressed to the safe overpull limit for the current note and string type).
Five color-coded bands appear on both sides. The principle: match the color. If the spectrum shows the note is in the "orange zone" on the left, overpull to the corresponding orange zone on the right. The white vertical line marks the maximum safe overpull limit (varies by note: ~12¢ for wound strings, 30-38¢ for unwound).
A magenta strike line appears at the moment of hammer impact, showing the initial pitch before settling. The info overlay (top-right) shows the overpull percentage and string type (wound/unwound).
How to use: Strike the note and observe where the peak lands on the left (flat) side. Raise pitch until the peak reaches the same color band on the right (overpull) side. The cyan center line is the final target—the pitch will settle there as the string relaxes.
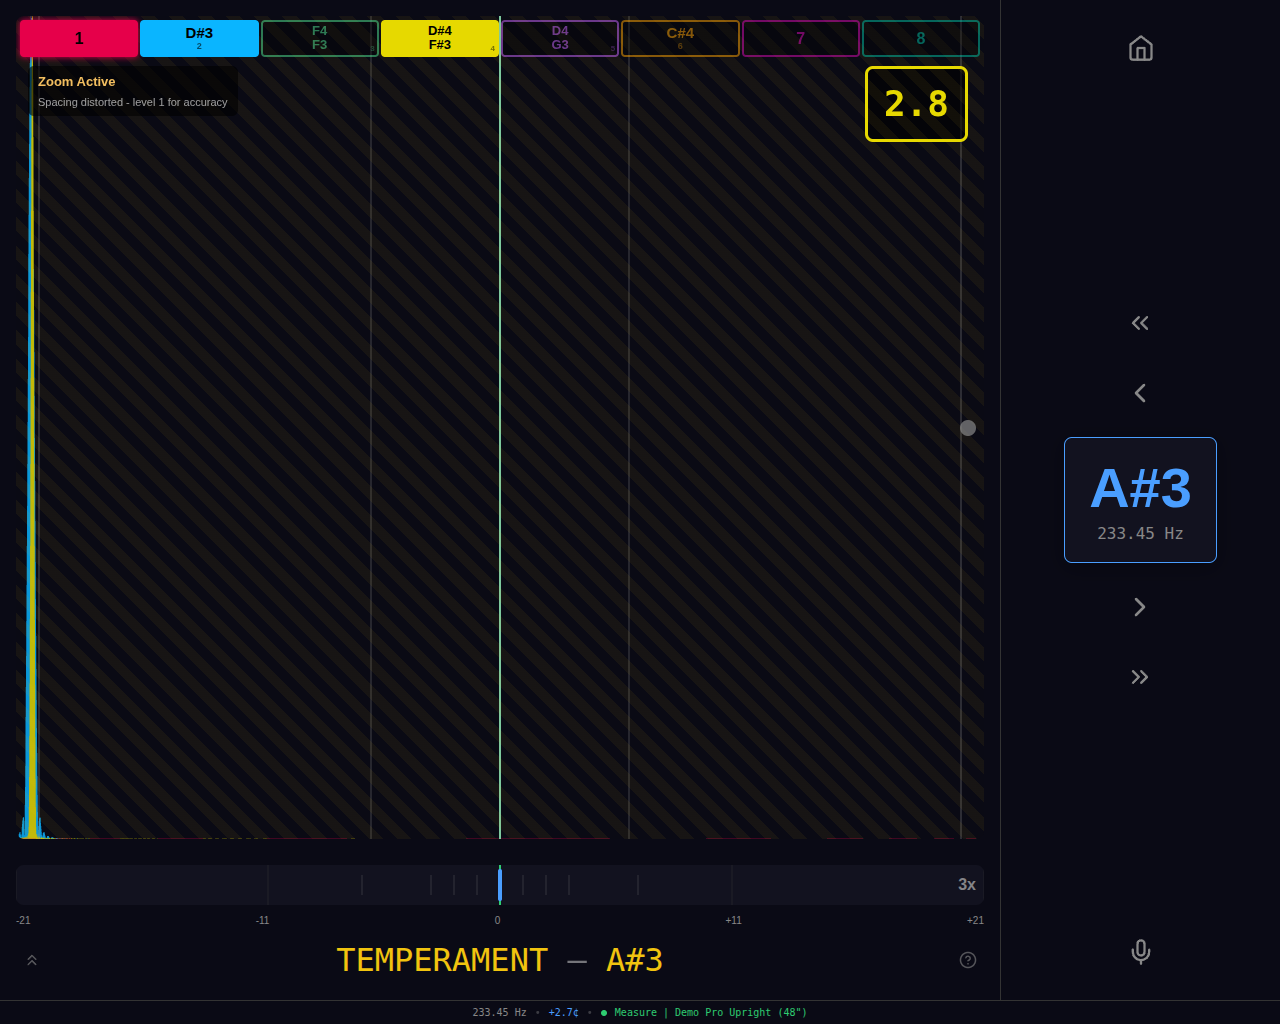
Aural
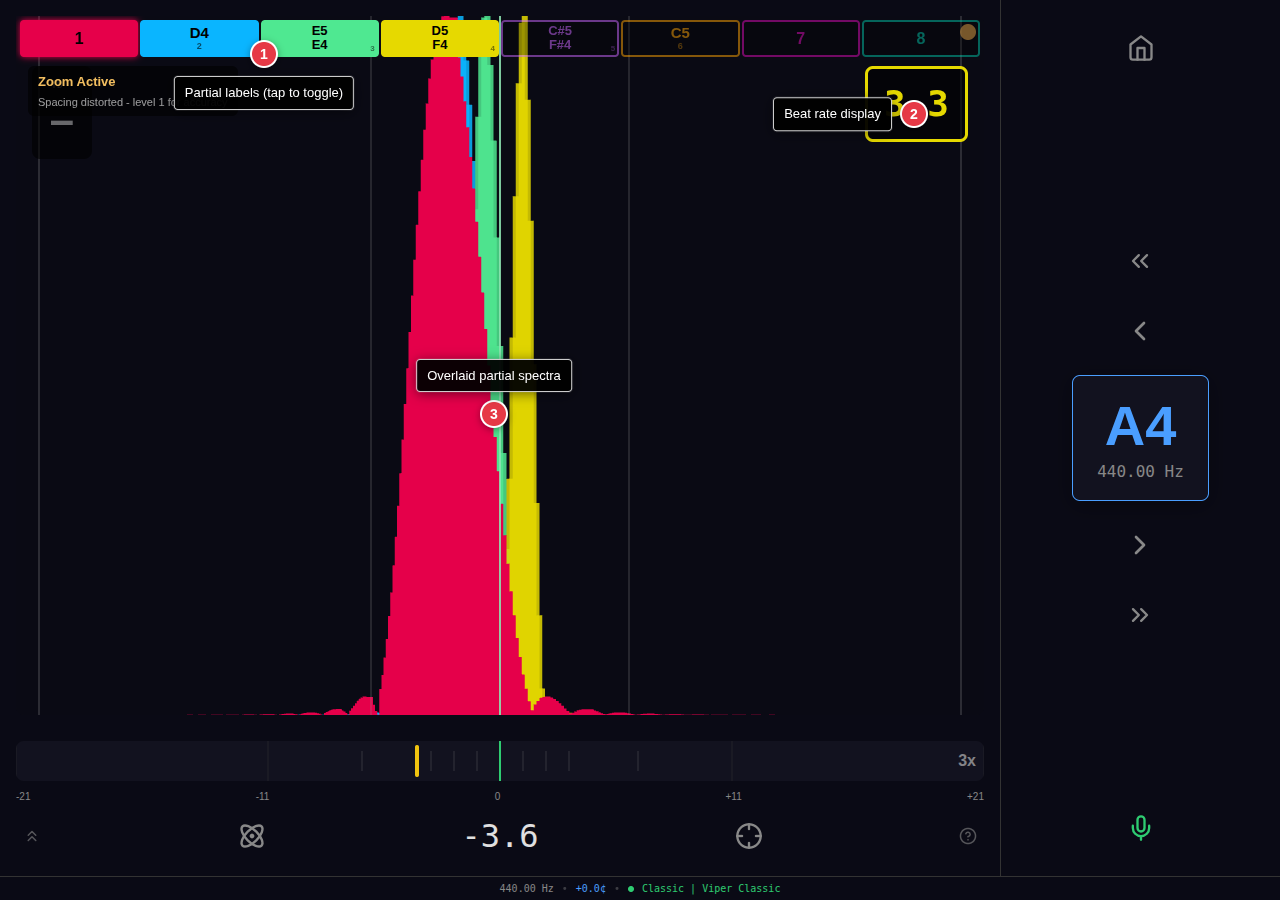
Overlays multiple harmonic partials on a single spectrum view. Each partial (P1-P8) is rendered in a distinct color, showing where that partial's energy falls relative to its expected position. This visualizes the same relationships you listen for in aural tuning.
The toggle buttons along the top let you enable/disable individual partials. Button labels show the reference notes for checking coincident partials (e.g., for A4: P3 shows E5/E4 for octave checks, P4 shows D5/F4 for fourths/thirds). The beat rate display (top-right, large number) shows the measured beat rate in Hz, colored to match the highest enabled partial.
How to use: Enable the partials you want to compare and observe their spacing. The visual separation between partial peaks corresponds to the beat rate you hear—for example, an F3-A3 major third should show approximately 7 Hz separation between coincident partials. Use this to verify beat rates match your target temperament rather than to eliminate beats. A warning appears when zoom distorts the spacing—use zoom level 1 for accurate partial relationships.
Waterfall
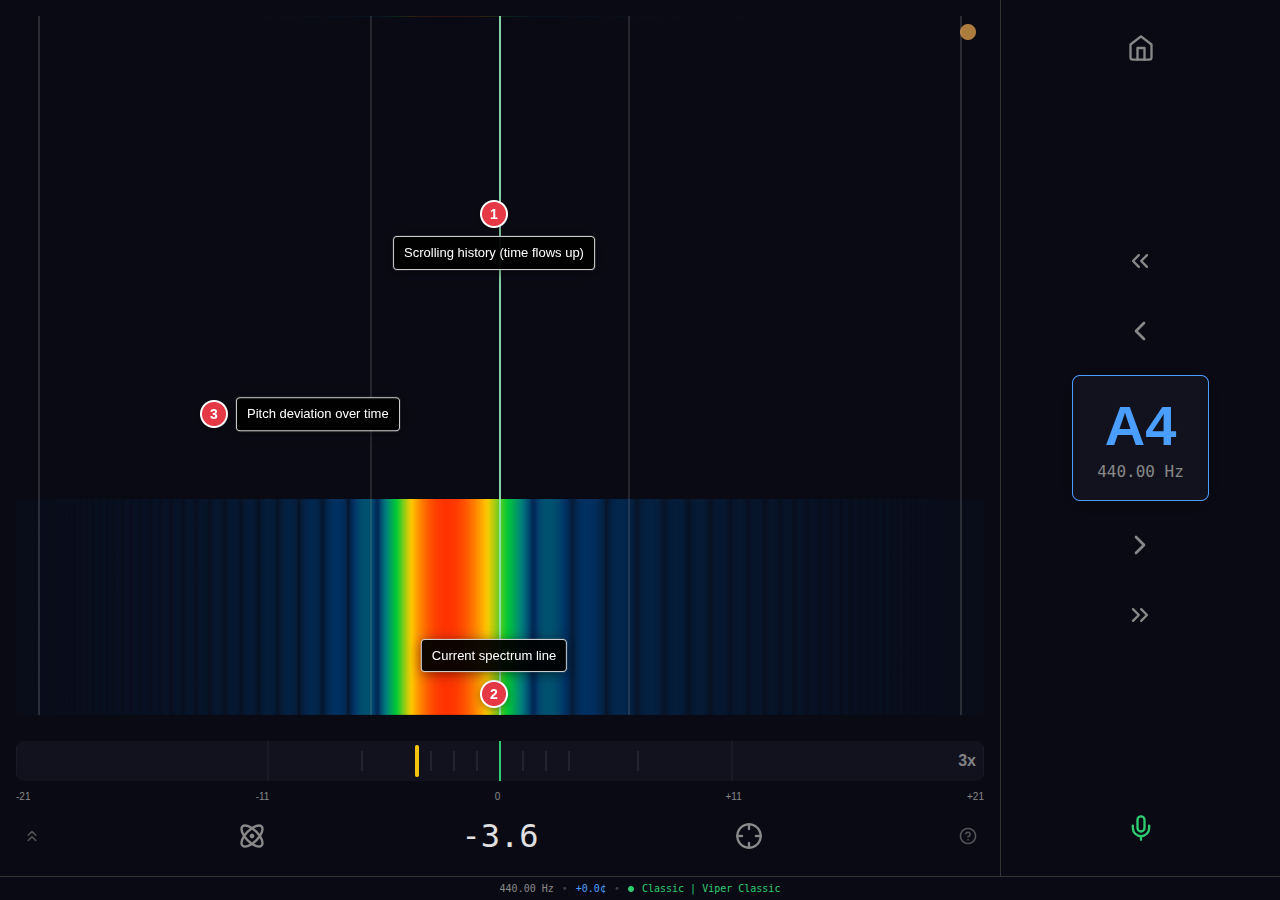
A scrolling spectrogram that shows pitch stability over time. The current spectrum appears at the top and scrolls downward, building a history. Color intensity indicates magnitude (dark blue → cyan → green → yellow → red). A vertical white center line marks the target pitch.
The gamma-corrected color mapping (power 0.35) expands low-magnitude detail, making beat patterns visible as horizontal ripples in the display.
How to use: Watch for a stable vertical line through the history. Wavering or curves indicate pitch instability. This mode excels at showing whether a unison is holding pitch or drifting, and for spotting false beats from unstable strings.
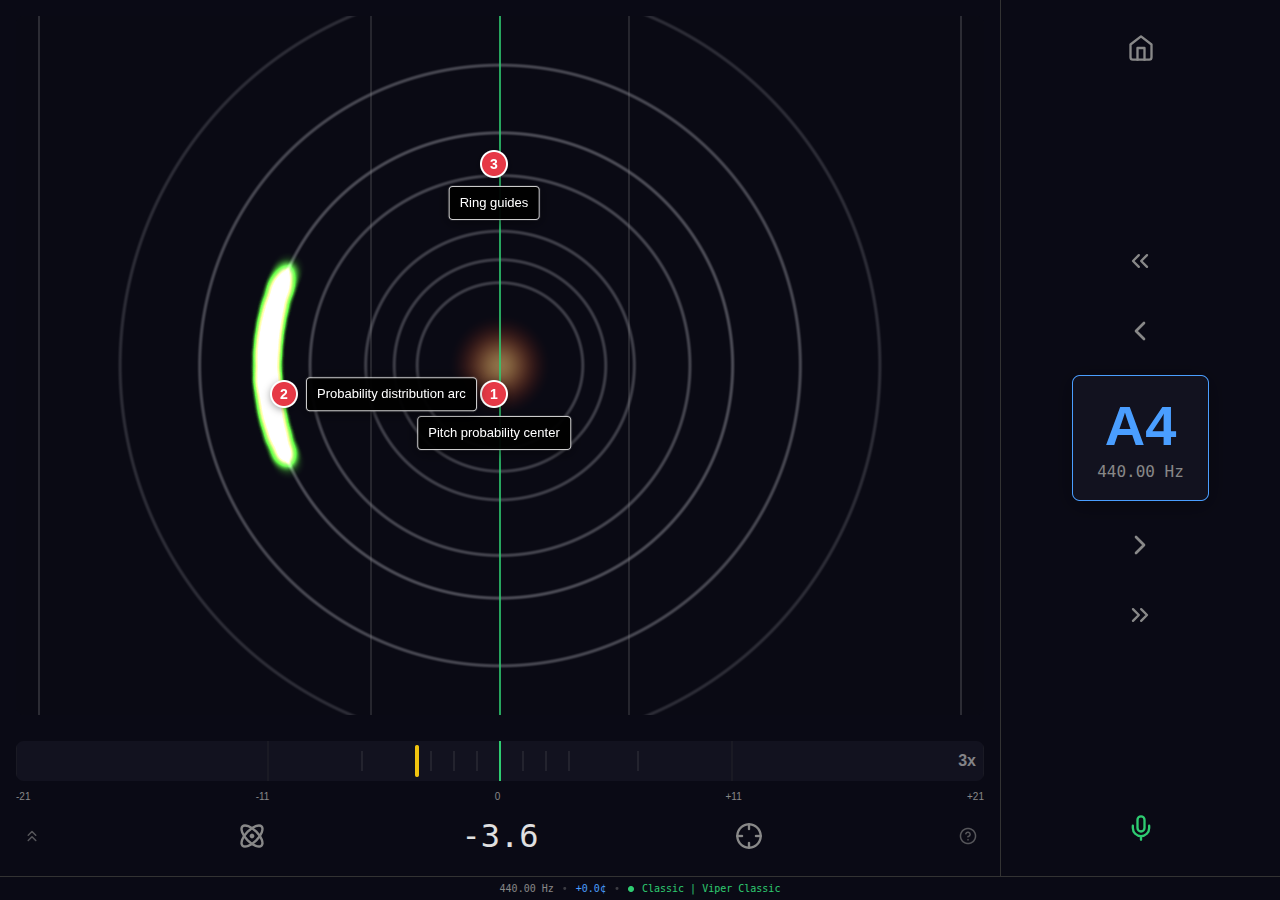
Concentric
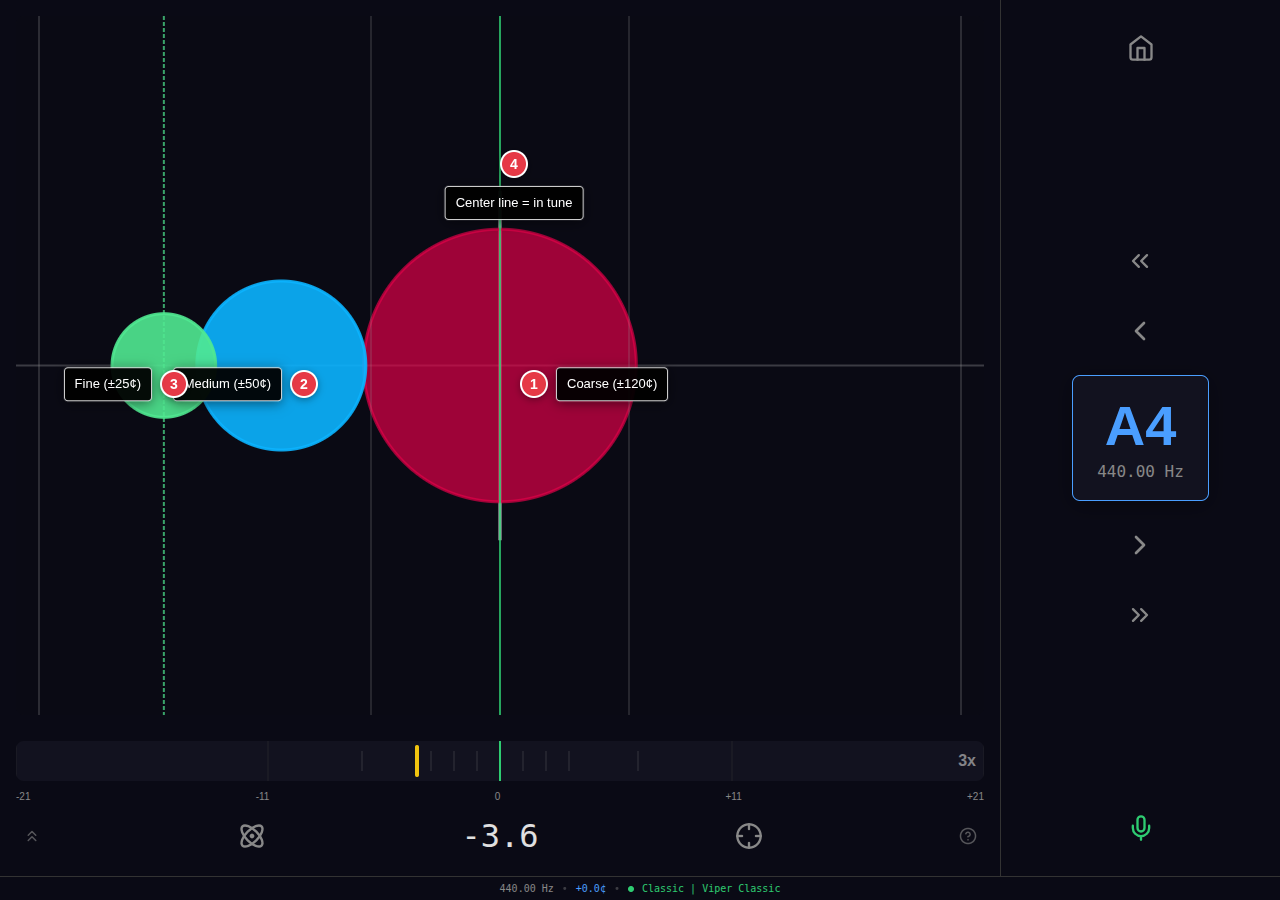
Three colored circles move horizontally based on pitch deviation. Each circle has a different sensitivity:
- Outer (red-pink): ±120 cent range, locks within 5¢
- Middle (blue): ±50 cent range, locks within 2.5¢
- Inner (mint): ±25 cent range, locks within 0.5¢
When a circle is within its locking tolerance, it snaps to center and fades slightly. The innermost circle provides the finest precision.
How to use: First bring the outer circles to center (coarse tuning), then focus on the innermost circle for fine adjustment. When all three circles are locked at center, the note is within ±0.25 cents. A dashed vertical line follows the innermost circle for precise tracking. This mode works well for technicians who prefer non-numeric feedback.
Lissajous
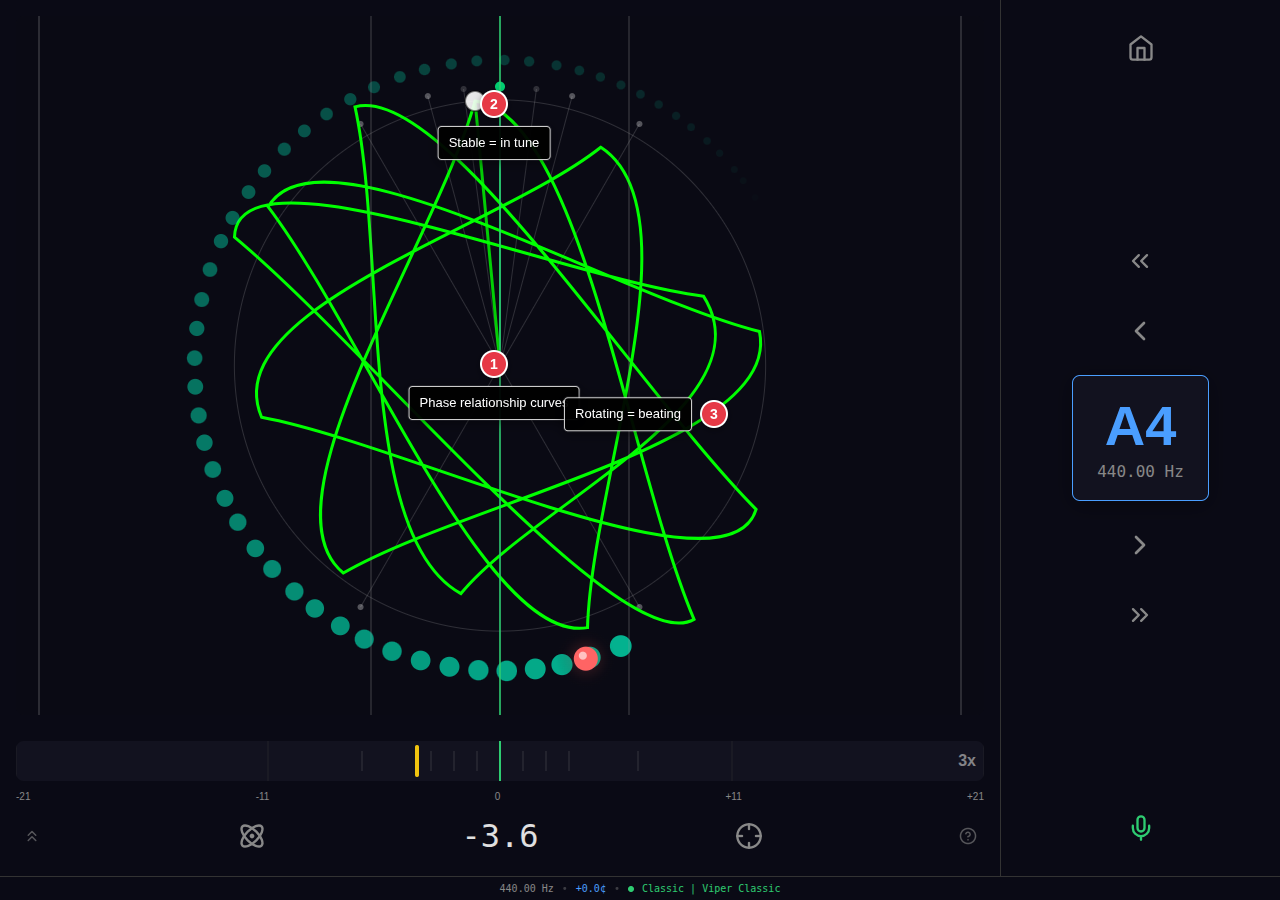
Combines a 13-point Lissajous figure with a heterodyne phasor indicator. The Lissajous curve (green) distorts based on pitch deviation—when in tune, the figure appears as a clean, symmetric shape; when detuned, the figure becomes asymmetric and irregular. A white indicator dot on the curve shows the pitch direction.
The phasor dot (outer orbit) provides precise phase lock indication: green = locked (phase velocity near zero), yellow = close, red = far. A trail shows recent phase history. Cent markers around the circle (-100, -20, -10, -5, 0, +5, +10, +20, +100) provide scale reference.
How to use: Adjust pitch until the Lissajous figure becomes symmetric and the phasor dot turns green and holds position. A pulsing lock indicator appears at center when phase-locked. This mode is excellent for finding the exact center of a beat.
Quantum
An electron-orbital visualization where 300 particles occupy discrete energy levels. Orbital shells are positioned at Fibonacci-spaced cent intervals: 0, 0.38, 0.62, 1, 2, 3, 5, 8, 13, 21, 34, 55 cents from center. Particles don't drift smoothly—they jump between orbitals based on the spectrum energy at each interval.
The central nucleus glows orange when particles are distributed across orbitals (detuned), and bright green when particles cluster in the ground state (in tune).
How to use: Tune until particles collapse into the center. The discrete orbital jumps create a satisfying "snap to tune" effect—rather than watching a needle drift, you see particles suddenly drop into the ground state when close enough. This mode provides intuitive feedback without requiring you to interpret numbers or directions.
Railsback
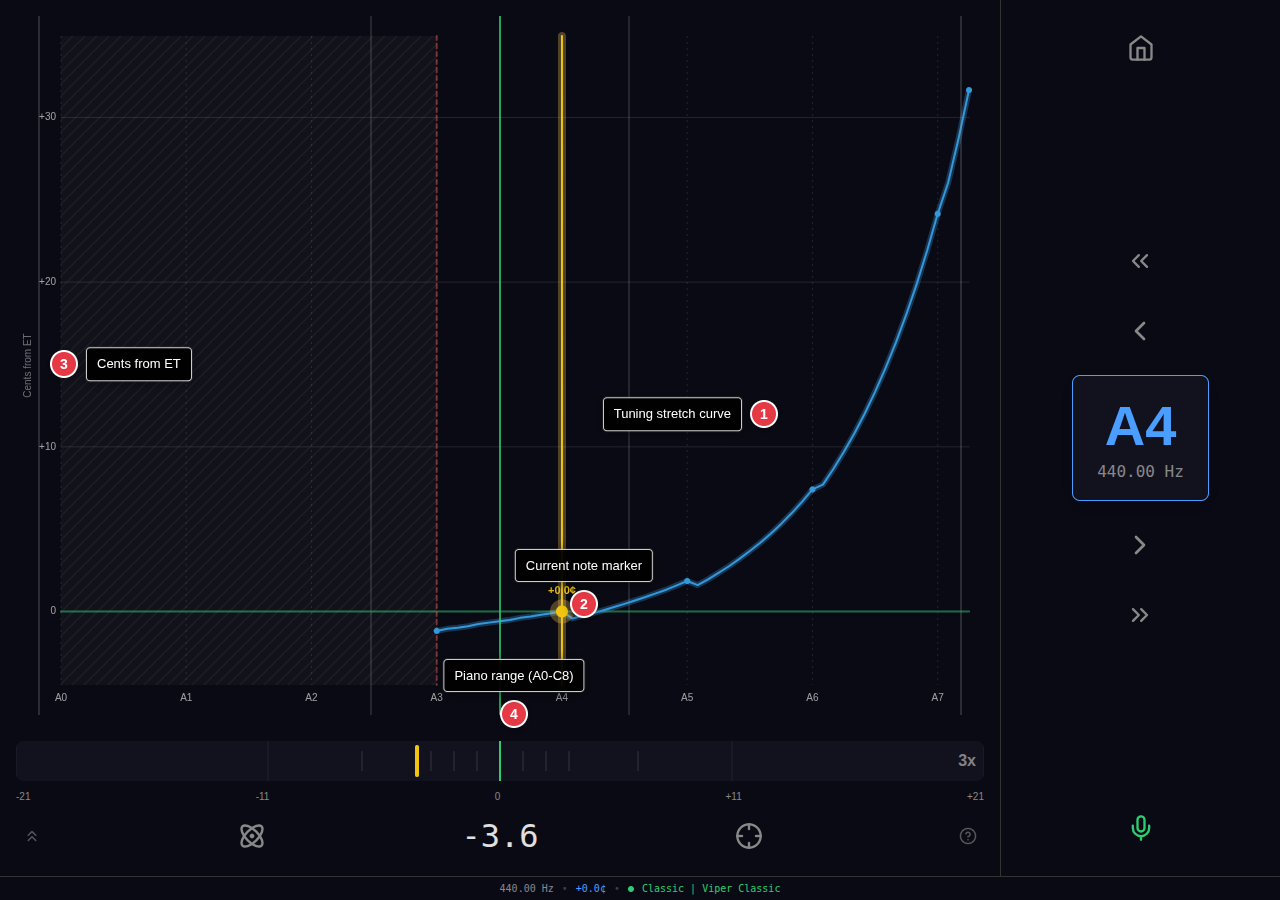
Displays the full 88-note tuning curve showing cents deviation from equal temperament. A0 to C8 spans the horizontal axis; vertical axis shows the target offset. The current note is highlighted with a yellow vertical line and a marker showing its target offset value.
Grid lines appear at octave boundaries (A notes) and at cent intervals. A green zero-line marks equal temperament. Shaded regions with diagonal hatching indicate notes without tuning data.
Classic mode note: In Classic mode, notes below A3 appear shaded because the bass is tuned using partial matching (P2, P3, P4, P6, P8 aligned to temperament notes) rather than direct pitch targets. This approach lets each piano's unique inharmonicity determine the bass stretch naturally—the curve varies by instrument. Only A3 and above show fixed cents values because treble inharmonicity is consistent across pianos.
How to use: This mode provides context rather than real-time feedback. Use it to understand the overall shape of your tuning curve, verify the stretch pattern makes sense, and see where the current note fits in the overall scheme. The curve shape should show characteristic bass flat / treble sharp stretch with smooth transitions.
Geometric
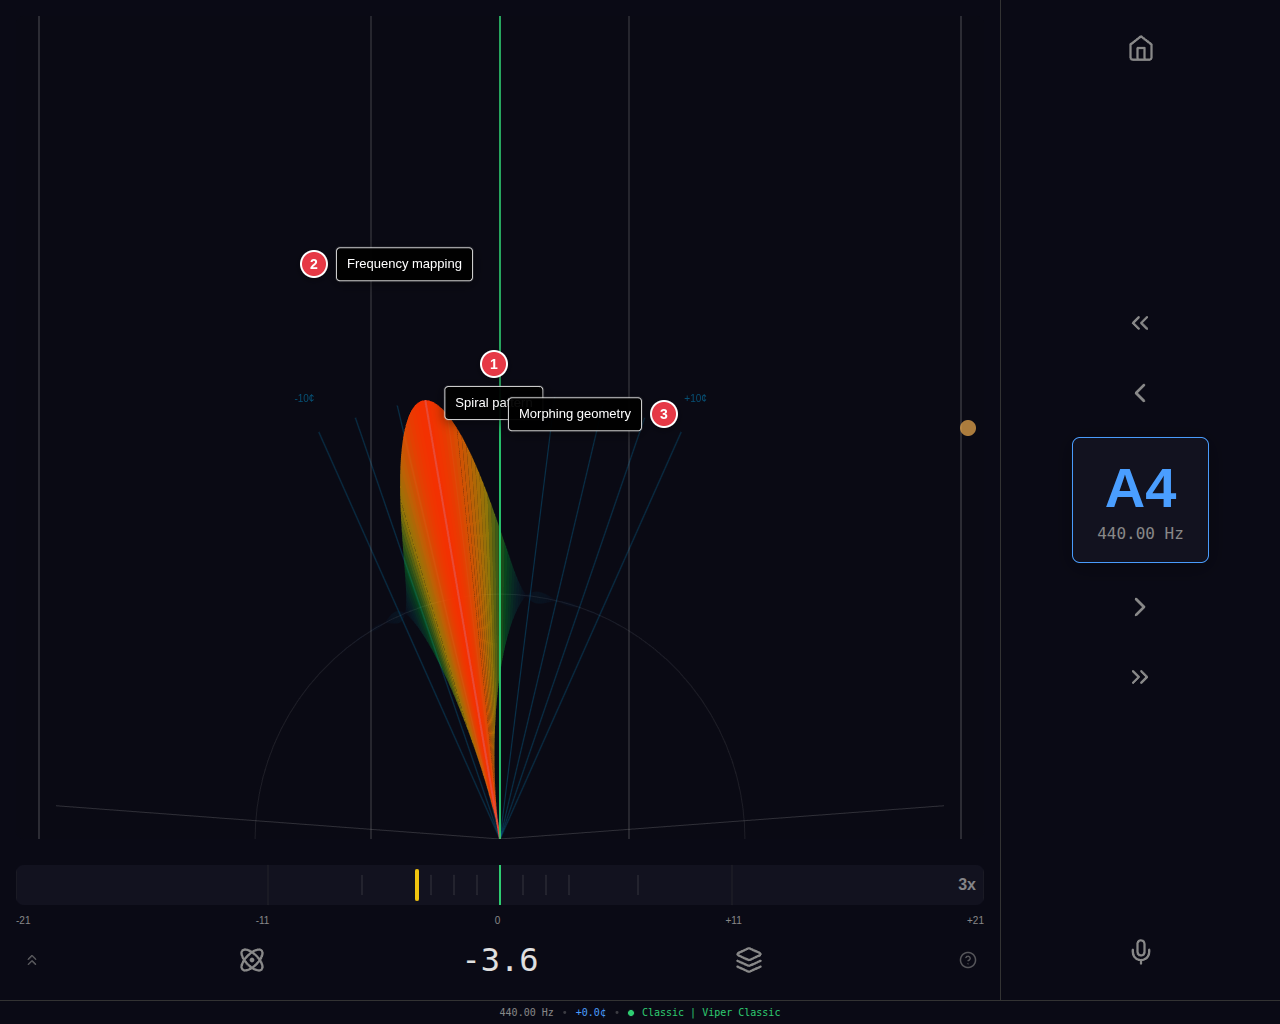
A geometric visualization that represents pitch deviation through radial symmetry. The display uses concentric geometric shapes that rotate and transform based on the current pitch relationship. Provides an aesthetically distinct way to see fine pitch deviations.
How to use: Watch for the geometric pattern to stabilize into a symmetric form when the note is in tune. Asymmetry and rotation indicate pitch deviation from the target.
IH Monitor
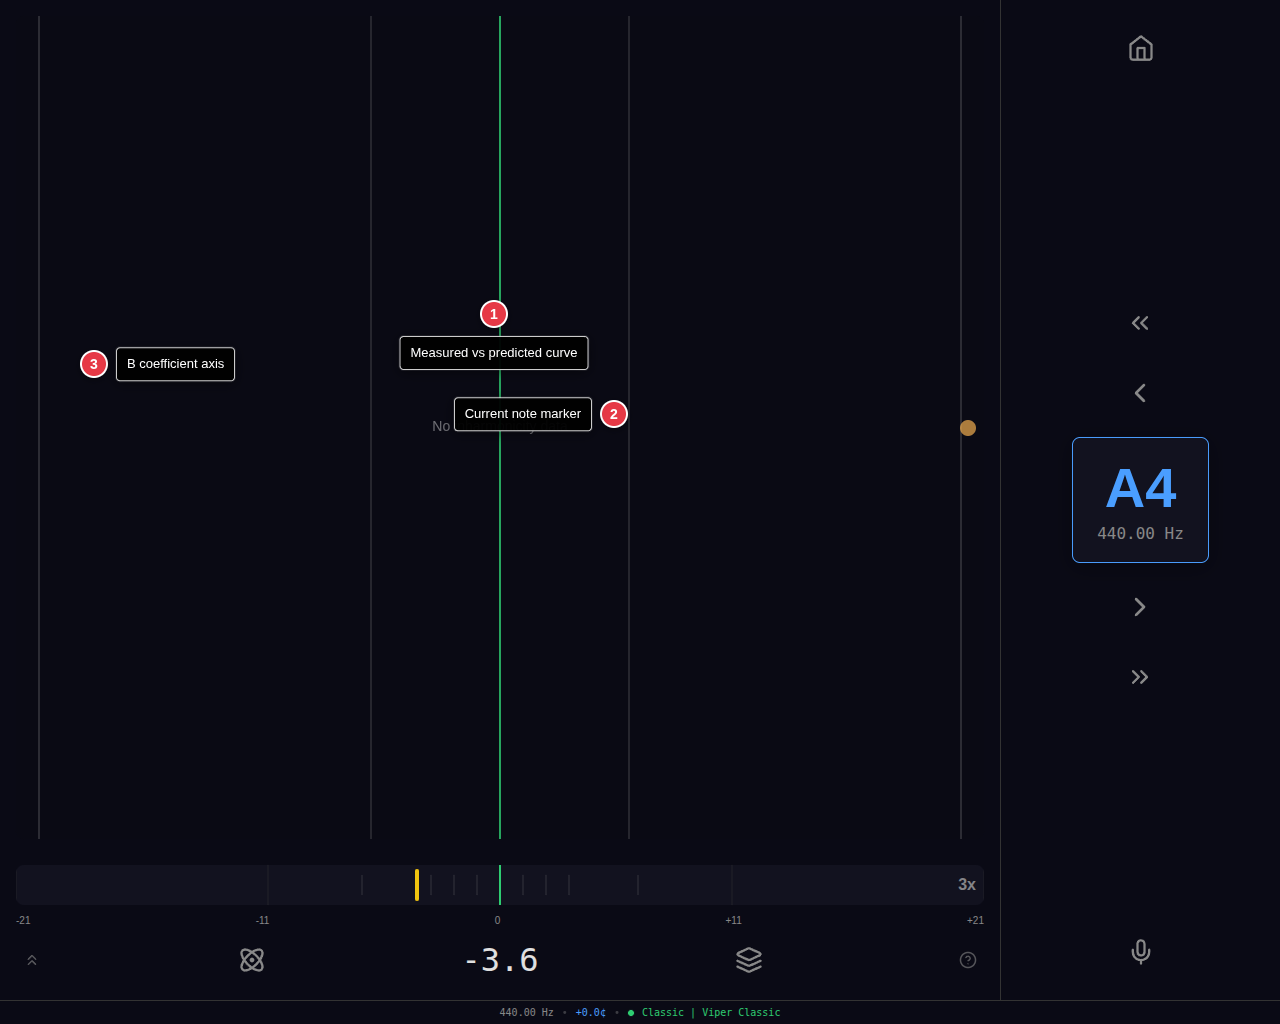
The Inharmonicity Monitor plots measured B coefficients against the predicted model curve in real time as you tune. Each strike updates the plot with the measured B value for the current note, shown as a dot against the model's predicted curve.
Deviations between measured and predicted values are immediately visible, alerting you to notes where the piano's actual inharmonicity diverges from the model—common at bridge transitions, duplex scaling boundaries, or on pianos with unusual stringing.
How to use: Dots that fall close to the predicted curve confirm the model is accurate for those notes. Outliers (dots far from the curve) indicate notes where the piano's actual inharmonicity differs from what was predicted. This information helps you understand why certain notes may feel "different" during tuning and can inform voicing decisions.
Tools
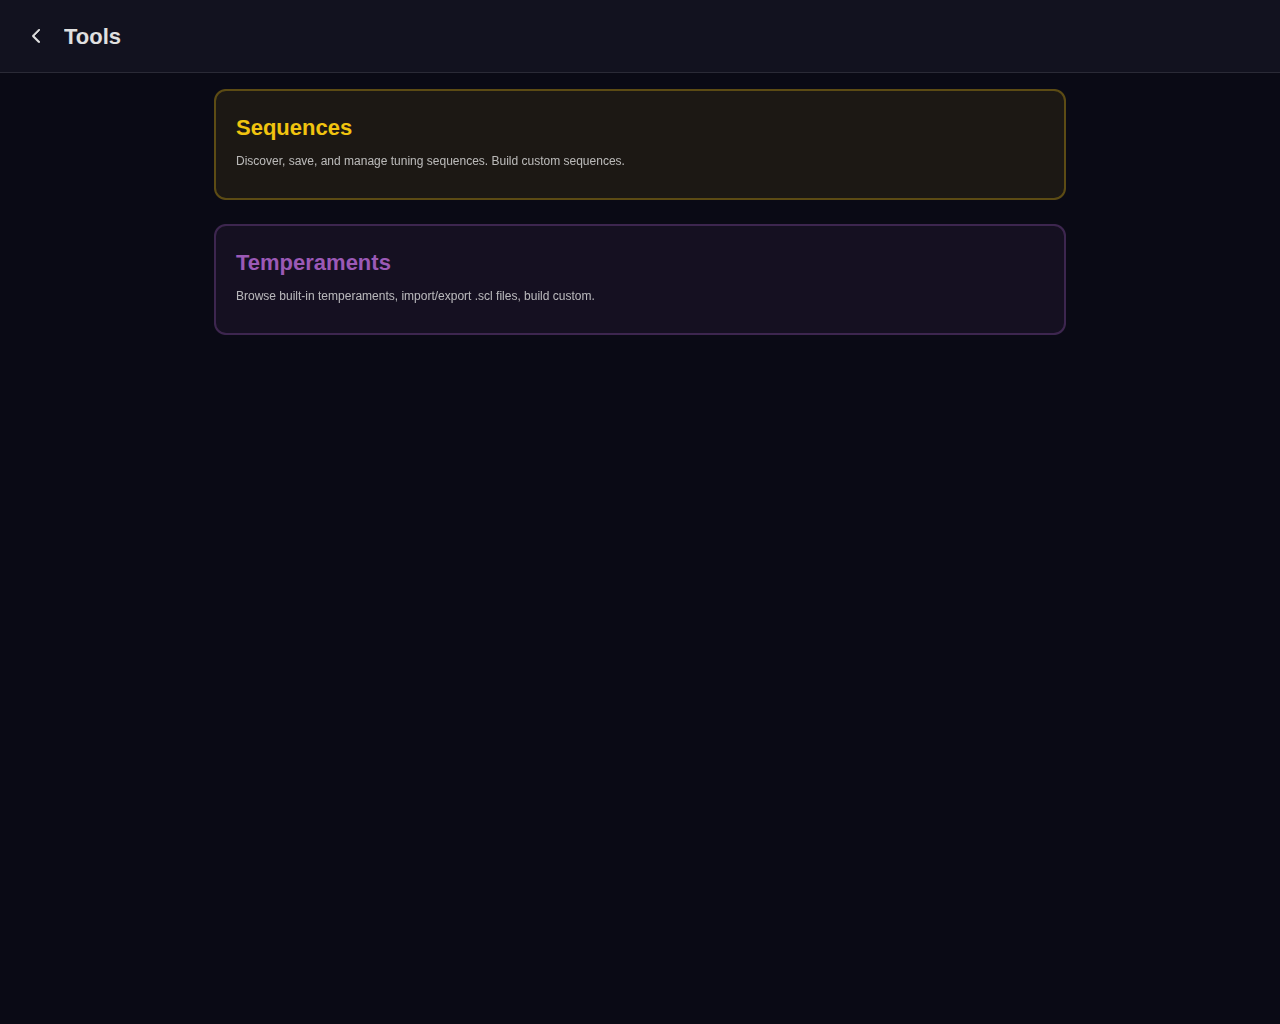
The Tools menu on the home screen provides access to aural tuning tools, the sequence finder, and the temperament browser. These tools work independently of either tuning workflow and can be accessed at any time.
Sequences
The Sequences screen discovers, saves, and manages aural tuning sequences—ordered sets of intervals used to set a temperament by ear.
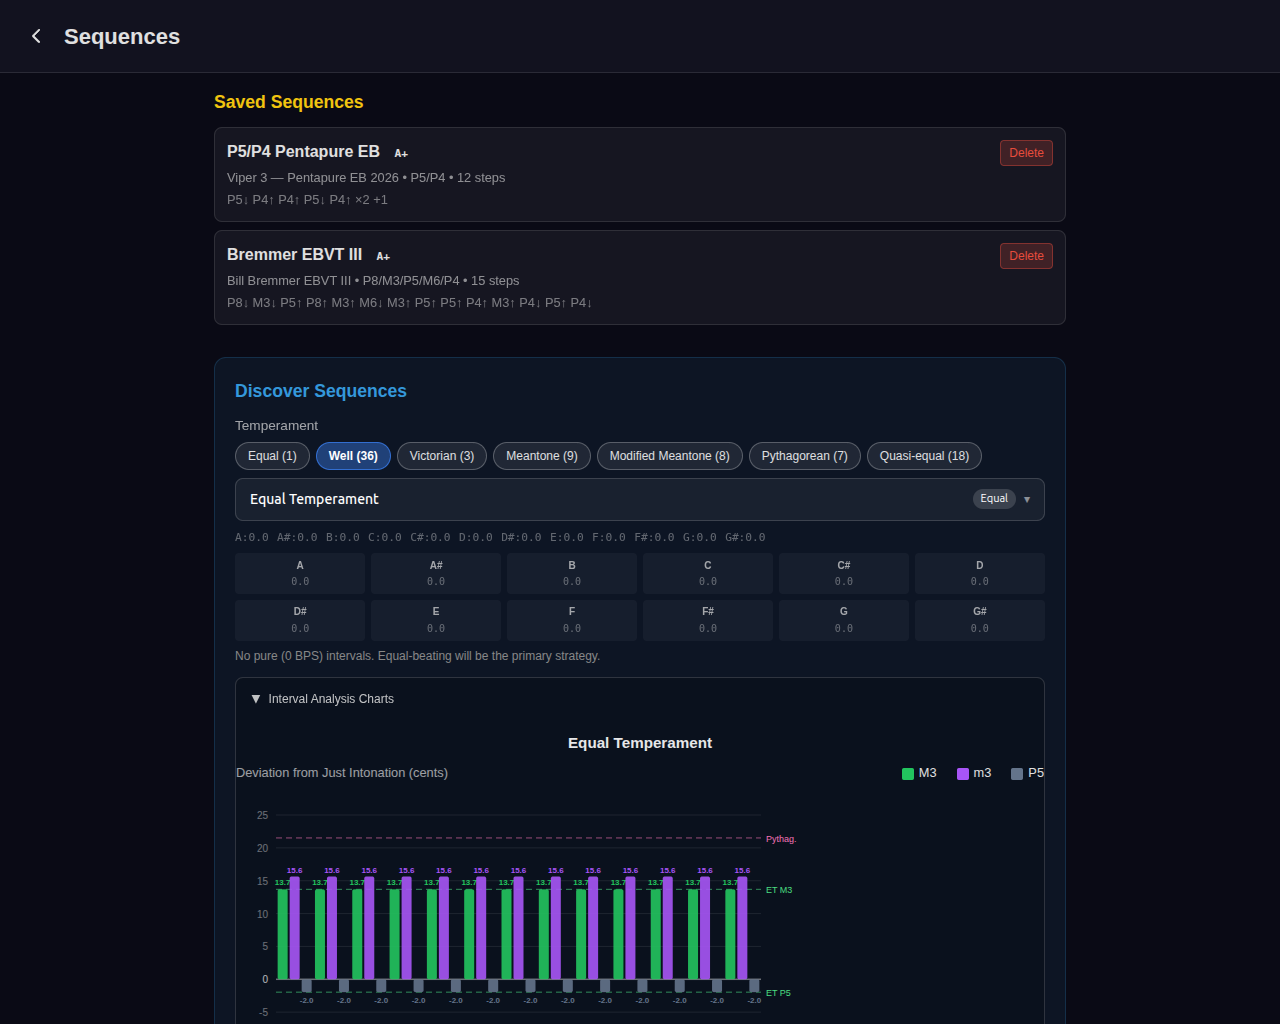
Saved Sequences
Previously saved sequences appear at the top. Each card shows the sequence name, grade (A+ through D), temperament, interval pattern, and step count. Tap a saved sequence to begin the guided Aural Temperament Workflow.
Discover Sequences
Configure the search in three steps:
- Select a temperament — Category pills filter by type (Equal, Well, Victorian, Meantone, Modified Meantone, Pythagorean, Quasi-equal). Choose a specific temperament from the dropdown. The cents grid and interval analysis charts below show the temperament's intervallic character.
- Choose intervals — Select at least 2 from: P4 (4:3), P5 (3:2), M3 (5:4), M6 (5:3), M10 (5:2). P4 and P5 are recommended (marked with a star).
- Search — Click to discover sequences ranked by quality.
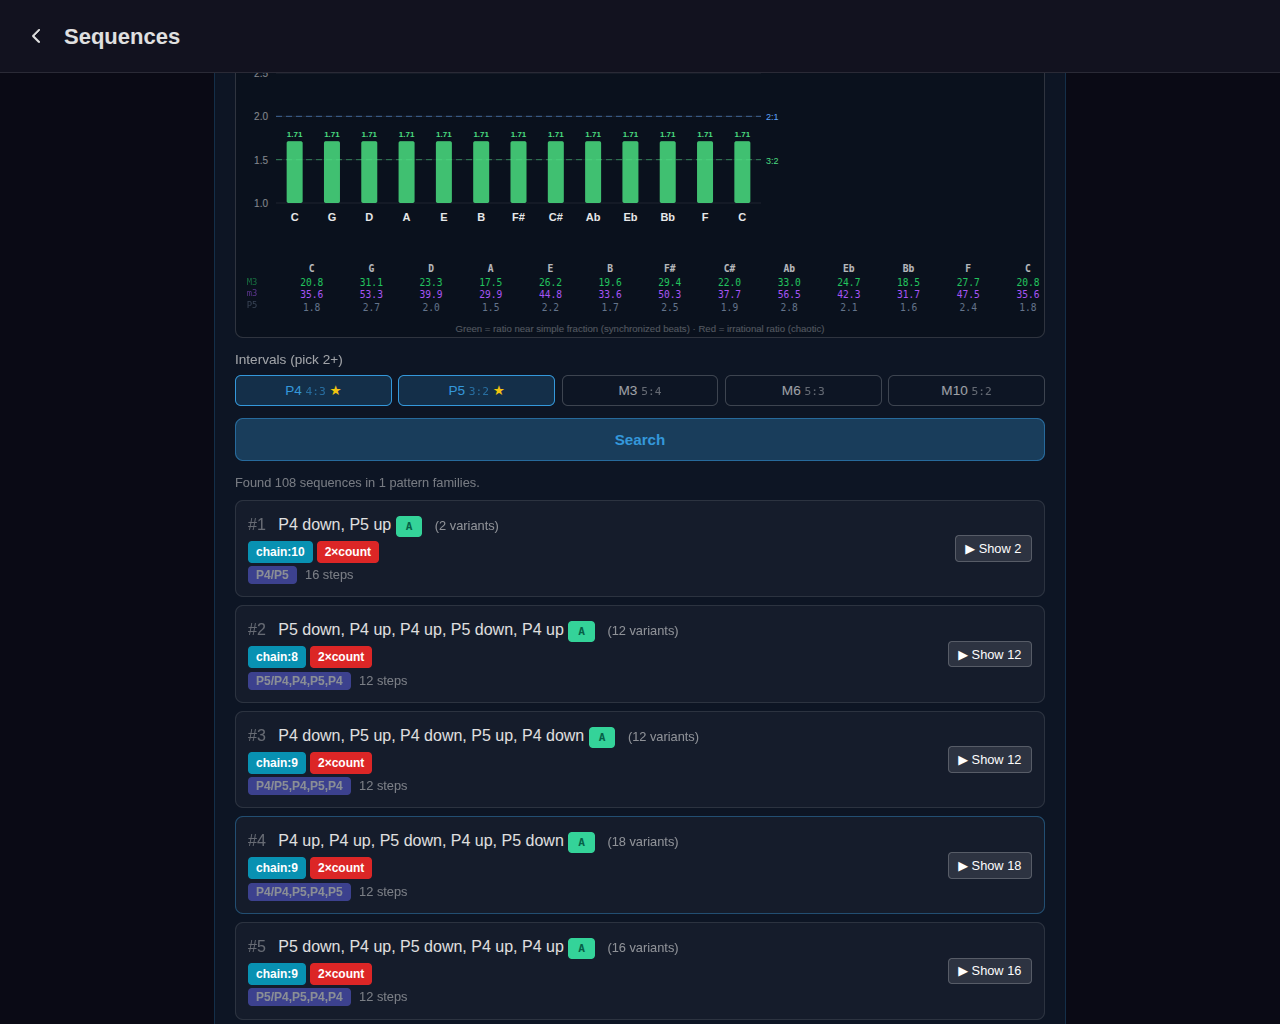
Results are grouped by pattern family—sequences that share the same interval structure but start on different notes. Each family card shows:
- Pattern and grade — The normalized interval sequence (e.g., “P4 down, P5 up”) and a letter grade (A+ through D)
- Badges — Quality indicators:
- chain:N — Longest chain of equal beat rates (higher = easier to tune)
- N×count — Number of steps requiring independent beat counting
- N×0BPS — Steps with pure (beatless) unisons
- Variants — Expand to see ranked starting-note variants with individual scores. Each variant can be saved or expanded to a full step-by-step detail view showing intervals, notes, and target beat rates.
Build Custom
The Create Manual Sequence button opens a builder modal where you define a step-by-step temperament procedure from scratch, choosing each interval and note pair manually.
Temperaments
Browse Temperaments
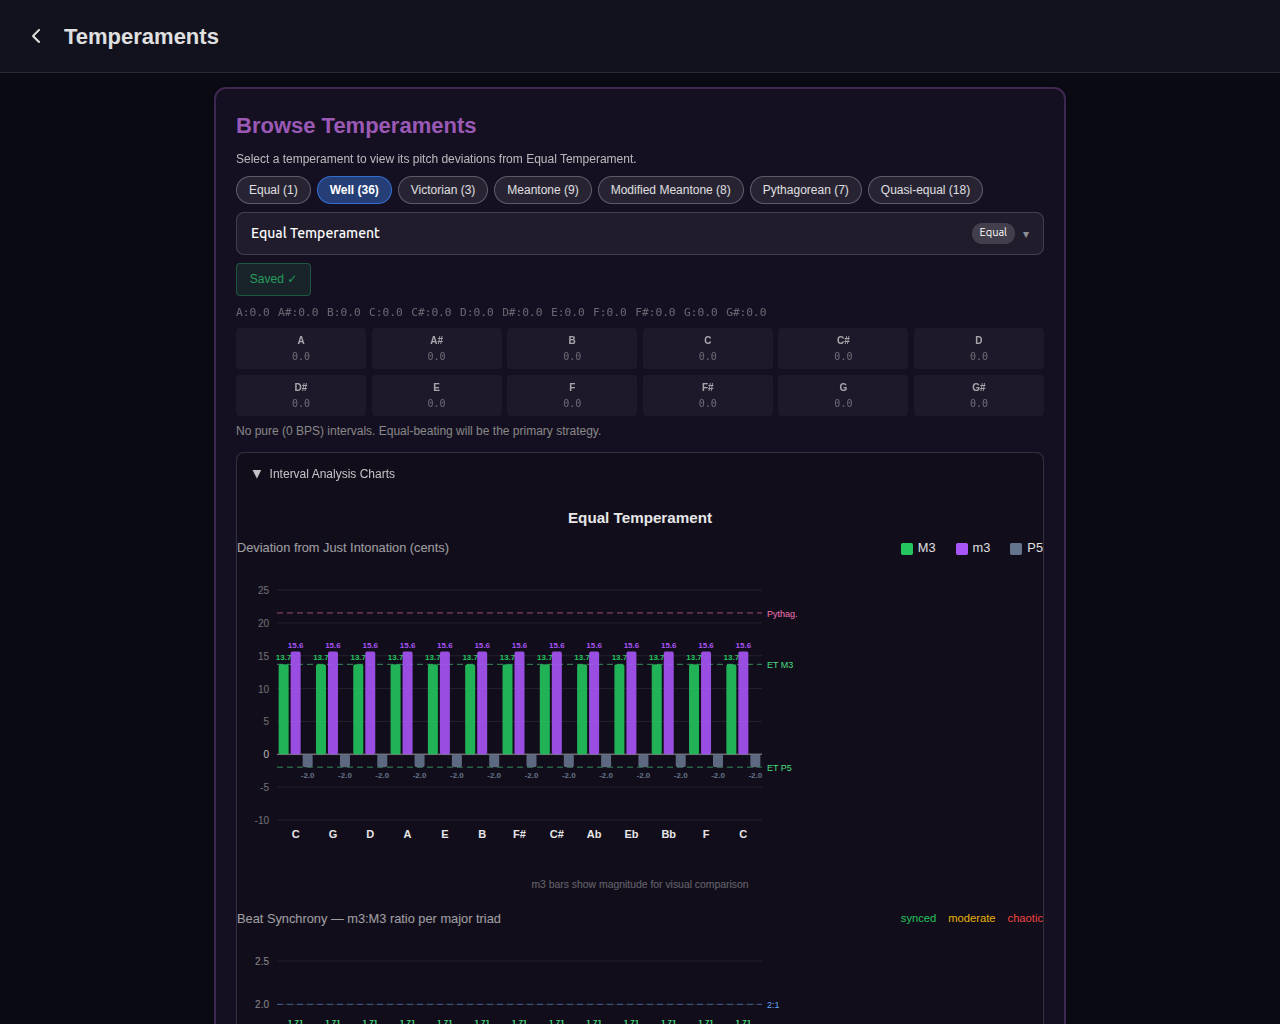
The Browse section provides access to the full temperament library. Category pills filter by type (Equal, Well, Victorian, Meantone, Modified Meantone, Pythagorean, Quasi-equal) with counts showing how many temperaments are in each category. Select a specific temperament from the dropdown to view:
- Cents grid — Pitch deviation for all 12 notes relative to Equal Temperament, color-coded (orange = sharp, blue = flat)
- Pure interval indicator — Shows how many pure (0 BPS) intervals the temperament contains and which strategy the sequence finder would use
- Interval analysis charts — Deviation from just intonation (M3, m3, P5) and beat synchrony ratios (m3:M3 per major triad) with color coding (green = synced, yellow = moderate, red = chaotic)
Click Save to My Temperaments to add any built-in temperament to your personal collection for quick access during finalization.
Custom Temperaments
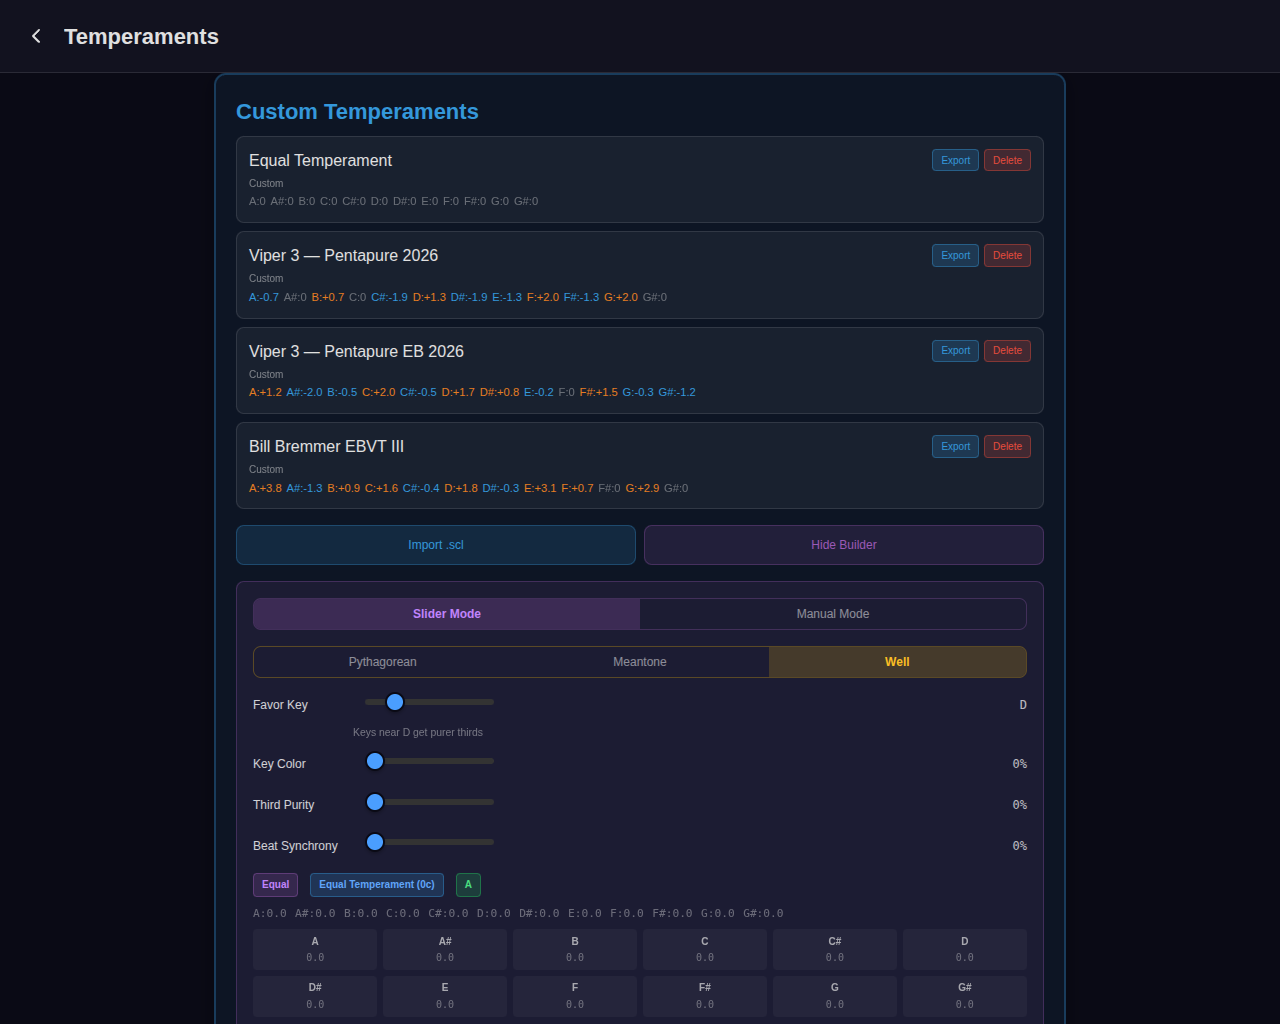
The Custom Temperaments section lists all user-created and imported temperaments. Each card shows the temperament name, type (Custom or Imported .scl), and non-zero cent values. Cards have Export (downloads as .scl) and Delete buttons.
Import .scl loads a temperament from a standard Scala file. Only 12-tone scales are supported.
Temperament Builder
The Build Custom button opens the builder with two modes:
- Slider mode — Choose a base type:
- Pythagorean — Adjust wolf fifth position, wolf spread, and beat synchrony
- Meantone — Adjust comma fraction (1/3 to 1/7), wolf fifth position, and beat synchrony
- Well — Adjust favor key (circle-of-fifths position), key color, third purity, and beat synchrony. Slider conflicts are shown with orange tension indicators
Real-time feedback shows the auto-detected category, nearest named temperament with distance, and tunability grade. The interval analysis charts update live as you adjust sliders.
- Manual mode — Set individual note offsets with 12 note pills (A is locked as reference at 0¢) and ±0.1/±1 cent adjustment buttons. Useful for entering published temperament specifications exactly.
Temperaments created or imported here are available in the finalization step of both Classic and Measure workflows, and in the Sequence Finder.
Session Management
Viper Tuner automatically saves your tuning sessions. The session system provides:
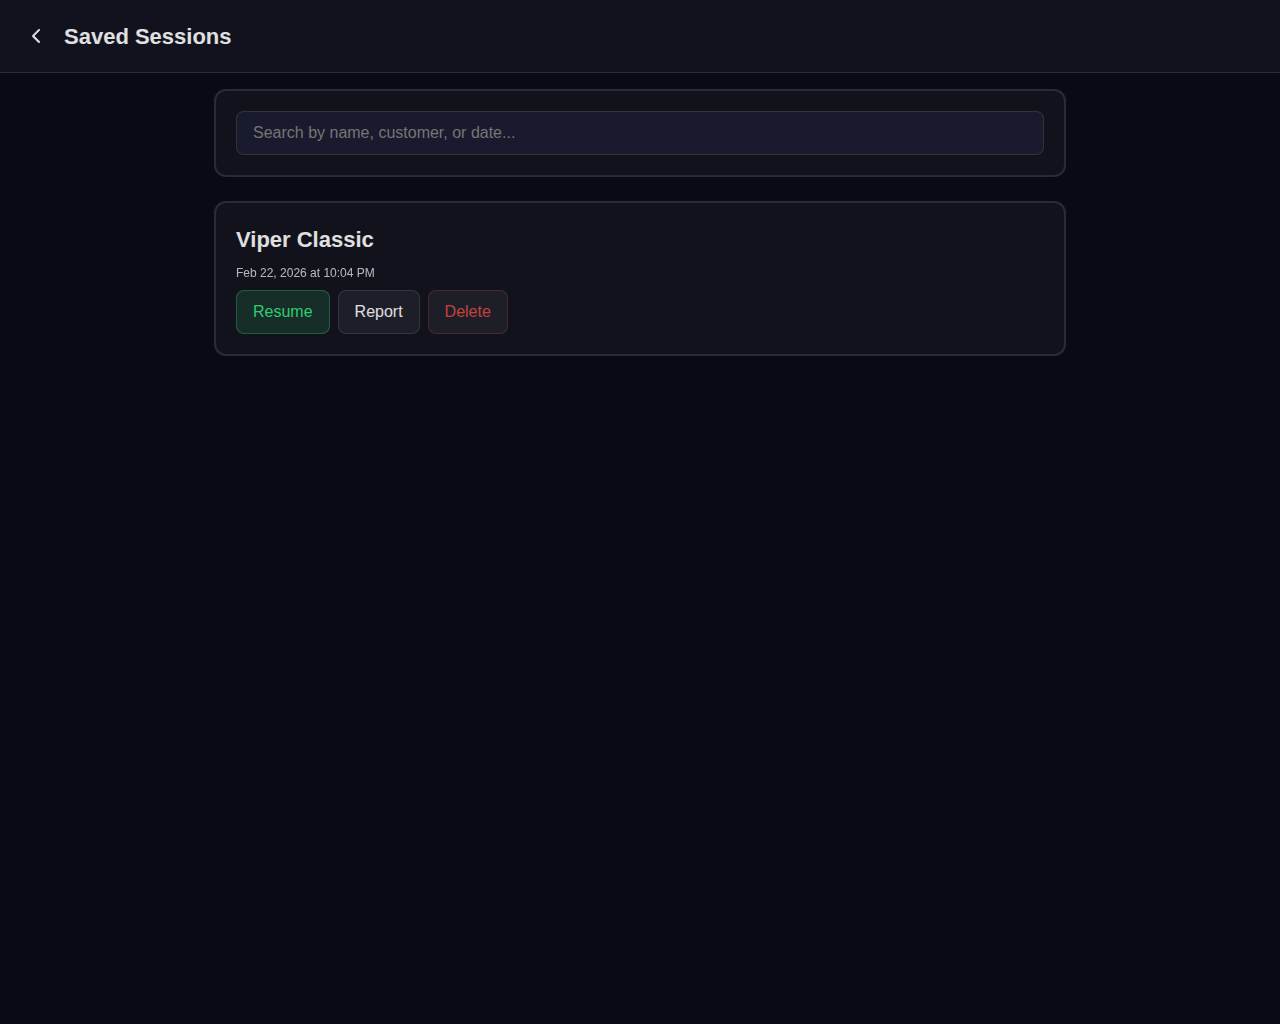
Session List
Access all saved sessions from the ALL SESSIONS button on the home screen. Each session shows:
- Date and time of the tuning session
- Workflow type (Classic or Measure)
- A4 reference pitch used
- Notes tuned count and progress
Resume
The RESUME SESSION button on the home screen immediately returns to your most recent active session, restoring the exact state: current note, visualization mode, zoom level, and all tuning data.
Crash Recovery
Sessions are saved continuously during tuning. If the app closes unexpectedly (browser crash, iOS background termination, power loss), your session will be available to resume when you reopen the app. No tuning data is lost.
Note: Sessions are stored locally on your device using IndexedDB. They are not synced between devices during the beta period. Cloud sync is planned for a future release.
Tuning Reports
After a tuning session, access the report from the session list by tapping a completed session. The report uses strike history data—every hammer impact recorded during tuning—to generate detailed analytics in two views.
Session Details
Both tabs share a Session Details card at the top. Simple mode shows the piano name (read-only), customer name, and technician notes fields. Switch to Advanced mode for additional fields: make, model, serial number, year, service address, temperature, and humidity. All fields are saved to the session.
Technician Tab
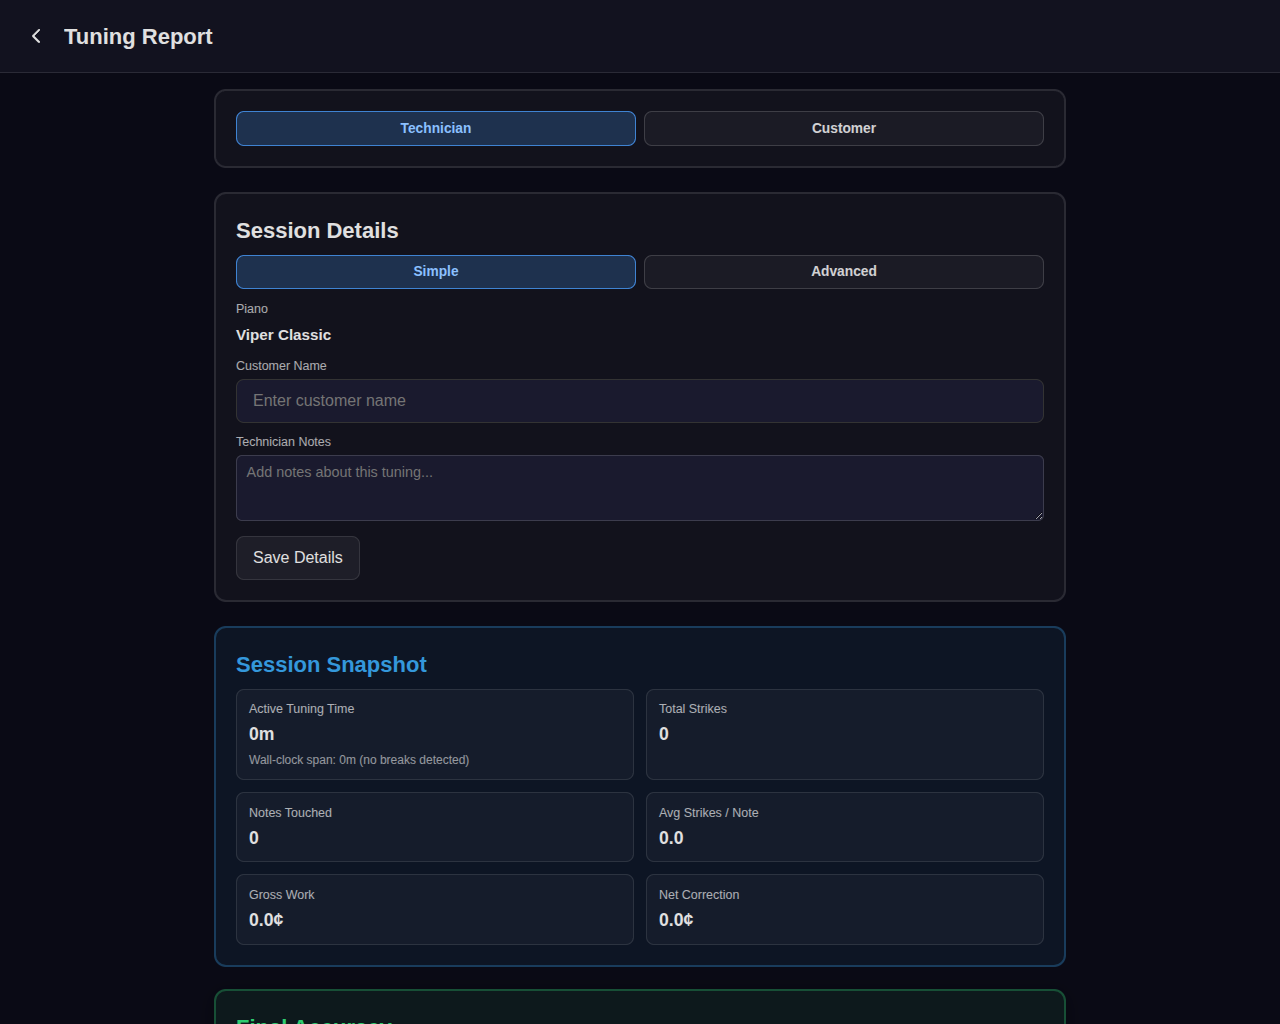
The technician view is your internal analytics record. It contains five cards:
Session Snapshot
Six-metric grid: active tuning time (with wall-clock span and break detection), total strikes, notes touched, average strikes per note, gross work (total cents of movement), and net correction (first strike to final strike).
Final Accuracy
Four metrics measuring your end result:
- Last Strike Avg — Average absolute cents offset of the final strike on each note
- Last 3 Avg — Average absolute cents offset across the last three strikes per note (more stable indicator)
- Within ±1¢ (Last) — Count and percentage of notes whose final strike landed within 1 cent of target
- Within ±2¢ (Last 3) — Count and percentage of notes averaging within 2 cents over their last three strikes
Starting Condition
Shown only if real pre-tuning measurement data exists (from the Measure workflow). Displays average signed offset, average absolute offset, and RMS deviation—quantifying how far out of tune the piano was before service.
Benchmark Comparison
Compares this session against up to 20 recent sessions. Shows your technician-wide average strike count and duration (with deltas), same-piano averages if the piano was tuned before, and links to the most recent prior session and most recent same-piano session.
Concerning Notes & Top Workload
Two tables at the bottom. Concerning Notes flags notes with high strike counts, large final offsets, or unusual patterns. Top Notes by Workload ranks the notes requiring the most strikes, showing first strike, final strike, and improvement (cents gained).
Customer Tab
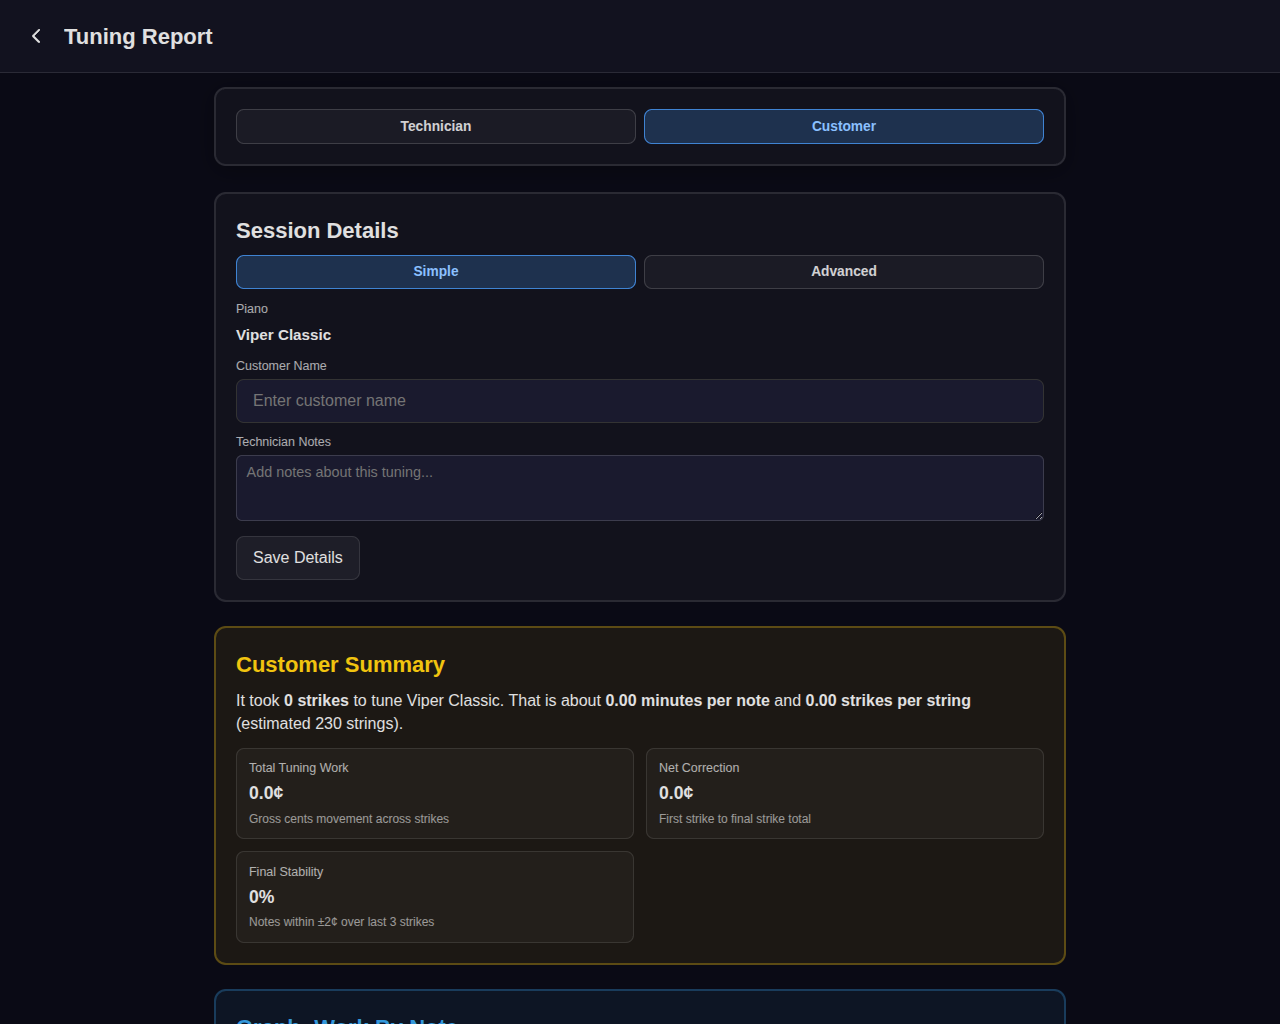
The customer view provides a non-technical summary suitable for sharing with the piano owner.
Customer Summary
An auto-generated narrative describing the tuning: total strikes, time per note, strikes per string (based on estimated string count), and overall results. If a customer name is entered in Session Details, the summary is personalized.
Metrics
Four-item grid: starting average offset (if measured), total tuning work (gross cents), net correction, and final stability (percentage of notes within ±2¢ over last three strikes).
Charts
- Work By Note — Bar chart showing strike count for each note across the full piano range (A0–C8). Quickly identifies which notes required the most attention.
- Before vs Final — Line graph overlaying the starting absolute offset (red) against the final offset (green) for each note. Only appears if pre-tuning measurement data exists.
Share
A pre-formatted text block contains the complete customer summary: piano name, tuning time, work completed, per-note and per-string rates, starting condition, accuracy, stability, follow-up notes, and technician notes. The Copy Summary button copies this text to the clipboard for pasting into emails or messages.
Note: Reports require strike history data. The strike detector records every hammer impact during tuning—sessions with no detected strikes will show zeroed metrics.